
WemaBank PlcNigeriaBank AnalysisJuly2020Financial dataUSDmcomparative311218311219NGNUSD avg30563064NGNUSD close30653065Total assets 1579823060Primary capital16601800Secondary capital805806Net ad ID: 862424
Download Pdf The PPT/PDF document "Nigeria Bank Analysis Public Credit Rat..." is the property of its rightful owner. Permission is granted to download and print the materials on this web site for personal, non-commercial use only, and to display it on your personal computer provided you do not modify the materials and that you retain all copyright notices contained in the materials. By downloading content from our website, you accept the terms of this agreement.


1 Nigeria Bank Analysis | Public Credit Ra
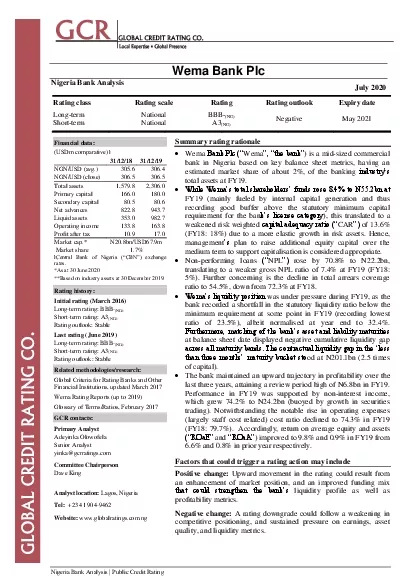
Nigeria Bank Analysis | Public Credit Rating Wema Bank Plc Nigeria Bank Analysis July 20 20 Financial d ata: (USD m c omparative ) ⱡ 31/12/1 8 31/12/1 9 NGN/USD (avg.) 305. 6 30 6 . 4 NGN/USD (close) 30 6 .5 30 6 .5 Total assets 1, 579.8 2,306.0 Primary capital 166.0 1 80 .0 Secondary capital 80.5 80. 6 Net advances 822.8 943.7 Liquid assets 353.0 982.7 Operating income 133.8 1 6 3.8 Profit after tax 10.9 17.0 Market cap.* N 2 0 . 8 bn/US D 67.9 m Market share 1. 7 % ⱡ FenPrMl BMnk of NigeriM (âFBNâ) excOMnge rates . * As at 30 June 20 20 ** Based on industry assets at 3 0 December 201 9 . Rating h istory : Initial r ating ( March 2016 ) Long - term rating: BBB - (NG) Short - te rm rating: A3 (NG) Rating outlook : Stable Las t rating ( June 201 9 ) Long - term rating: BBB - (NG) Short - term rating: A3 (NG) Rating outlook: Stable Related m ethodologies /r esearch : Global Criteria for Rating Banks and Other Financial Institutions, u pdated March 20 1 7 Wema Rating Reports (up to 20 1 9 ) Glossary of Terms/Ratios, February 201 7 GCR contacts: Primary Analyst Adey inka Olowofela Senior Analyst yinka @gcrratings.com Committee Chairperson Dave King Analyst location: Lagos, Nigeria Tel: +23 41 904 - 9462 Website: www.globalratings.com.ng Summary r ating rationale ï· Wema BMnk Plc (â Wema â, âPOe NMnkâ ) is a mid - sized commercial bank in Nigeria based on key balance sheet metrics, having an estimated market share of about 2% , of the banking indusPryâs total assets at FY19. ï· WOile WemMâs PoPMl s OMreOoldersâ funds rose 8B4% Po NDDB2Nn MP FY19 (mainly fueled by internal capital generation and thus recording good buffer above the statutory minimum capital require ment for the ban kâs license cMPegory ), t his translated to a weakened risk weighted cMpiPMl MdequMcy rMPio (â CAR â) of 13.6% (FY18: 18%) due to a more elastic growth in risk assets. Hence, m anagement âs plan to raise additional equity capital over the medium term to support capitalisation is considered appropriate. ï· N on - performing loan s (â NPL â) rose by 70.8% to N22.2bn , translating to a weaker gross NPL ratio of 7.4% at FY19 (FY18: 5% ). Further concerning is the decline in tota l arrears coverage ratio to 54.5% , down from 72.3 % at FY18. ï· WemMâs liquidiPy posiPion was under pressure during FY19 , as the bank record ed a shortfall in the statutory liquidity ratio below the minimum requirement at some point in FY19 (recording lowest ratio of 23.5%) , albeit normalis ed at ye ar end to 32.4%. FurPOermore, mMPcOing of POe NMnkâs MsseP Mnd liMNiliPy mMPuriPies at balance sheet date displayed negative cumulative liquidity gap Mcross Mll mMPuriPy NMndsB TOe conPrMcPuMl liquidiPy gMp in POe âless POMn POree monPOsâ mMPuriPy NuckeP sPo od at N201.1bn (2.5 times of capital). ï· Th e bank maintained an upward trajectory in profitability over the last three years, attaining a review period high of N6.8bn in FY19. Performance in FY19 was support ed by n on - interest income , which grew 74.2% to N24.2b n (buoyed by growth in securities trading). Notwithstanding the notable rise in operating expenses (largely staff cost related) cost ratio declined to 74.3% in FY1 9 (FY18 : 7 9.7 %). Accordingly, return on average equity and assets (â ROMEâ and âROMAâ ) improved to 9.8% and 0.9% in FY19 from 6.6% and 0.8% in prior year respectively. Factors that could trig ger a rating action may include Positive change : Upward moveme nt in the rating could result from an enhancement of market position , and a n improved funding mix POMP could sPrengPOen POe NMnkâs liquidity profile as well as profitability metrics. Negative change : A rating d owngrade could follow a weakening in competi tive positioning , and sustained pressure on earnings, asset quality , and liquidity metrics . Rating class Rating scale Rating Rating outlook Expiry date Long - term National BBB - (NG) Negative May 20 2 1 Short - term National A3 (NG) Nigeria Bank Analysis | Public Credit Rating Page 2 Organisational profile Corporate summary 1 Wema, i ncorporated in 1 945 (under the old name of Agbonm agbe Bank Limited) , is NigeriMâs longesP survivi
2 ng indigenous b ank. The bank becam
ng indigenous b ank. The bank became a public limited liability company in 1987 and its share s were subsequently listed on The Nigeria Stock Exchange (âNSEâ) in 1EE1B Following a strategic r epositioning exerci se in 2009, Wema opted for a regional banking licence , focus ing on its key market jurisdictions and strengths. Pursuant to meeting CBN requirements (including the minimum capital requirement for a national bank), Wema was granted a national banking licence by CBN in November 2015. The bank provides a range of retail a nd small and medium enPerprise (âSMEâ) banking, corporate, treasury, trade services and financial advisory products/ services to its numerous corporate and individual customers. Ownership struc ture TOe NMnkâs sOMreOolding sPrucPure remMined relMPively stab le in F Y19 , comprising a well - diversified oRnersOip NMseB WemMâs sOMres Rere Oeld Ny over 24 4 , 522 corporate and individual investors at 31 December 201 9 . Table 1, shows the major shareholders w ith stake above 5%. Table 1: Major shareholders % Holding FY 1 8 FY1 9 Neemtree Limited 27.7 27.8 Oduâa Investment Company 10.0 8.3 Petrotrab Limited 8.5 8.5 Sw8 Investment Company Limited 8.2 14.9 Others (5%) 45.6 40.5 Total 100.0 100.0 Source: We ma AFS. Strategy and o perations Wema âs medium Perm sPrMPegy is geared towards attaining and sustaining strong profitability growth, particularly within the retail banking segment. To this end, t he bank has continued to improve service delivery through bet ter use of technology and a robust contact centre . T he bank als o ensures continu ous brand refresh ing for improved acceptability. The bank â s digiPMl NMnking plMPform, âAIATâ is being used to drive growth aggressively within the retail market and SME s , which ac cording to management, has delivered notable increase in tra nsaction volume conducted by customers via the digital platform . Similarly, âSARAâ , a product designed to help women scale up their businesses has also accelerated the pace of increase in the b Mnkâs client base. The bank also launched some healthcare produ cts recently . Wema âs operMPions Mre supported by the latest version of Finacle . At end - December 201 9 , Wema operated through a network of 15 7 branches, 7,156 active POS terminals, 3 82 ATM, 3,1 86 Agen cy partners and a staff complement of 1, 172 . 1 Refer to previous report issued by GCR for a detailed background. Governanc e structure The composiPion of POe NMnkâs NoMrd of direcPors (âNoMrdâ) Mnd iPs governance structure are in line with FBNâs code of corporMPe governMnce for NMnks in Nigeria, and that of the Sec urities and Exchange Fommission (âSEFâ) for lisPed compMnies . T he NMnkâs board composition and adherence to selected aspects of appropriate corporate governance are as highlighted below . D escription Findings Board size 1 1 member s Number of executive d ir ectors 4 (Including Managing Director) Number of non - executive d irectors 7 (Including Chairman) Independent directors Yes, 2 Tenure of non - executive directors 4 years each/max. 2 cycles Number of board committees 5 ( Risk Management, Audit, Credit, Fin ance and General Purpose, Nomination and Governance, and Statuto ry Audit ) Internal audit and compliance Yes, independent unit External auditors and rotation policy Deloitte & Touche /10 year t enure (renewable annually) Financial reporting The audited fi nancial statement s were prepared in accordance with International Financial Reporting SPMndMrds (âHFRSâ) , the Banks and Other Financial Institutions Act and the F inancial Reporting Council of Nigeria requirements. T he NMnkâs external auditor , Deloitte & To uche , issu ed a clean audit opinion on the FY1 9 financial statemen t s . Operating environment Economic overview The Nigerian economy sustained growth momentum in 201E, RiPO POe gross domesPic producP (âGGPâ) expanding by 2.27% y/y, up from 1.91% registered in 2018. The recorded growth was largely underpinned by the curt ailed pipeline vandalism, calmness in the oil - producing regions, and the relative stability in gloNMl crude oil prices Mnd foreign excOMnge (âFXâ) market. While the oil sector registered a ro bust growth of 4.59% (2018: 0.97%), the non - oil sector improved s lightly by 2.06% in 2019 relative to 2% recorded in 2018. However, the Nigerian
3 economy is currently witnessing a sharp
economy is currently witnessing a sharp slowdown due to the coronavirus diseMse (âFOVHG - 1Eâ), ROicO is Neing co mpounded by the contraction in crude oil demands and dwindling pr ices at the international market. In a bid to stimulate prices, the Organisation of Petroleum Exporting Countries (OPEC) and its allies in mid - April 2020 agreed to a global production cut of about 10 million barrels per day. This production cut, coupled wi th the gradual easing of lockdown across most countries resulted in an uptick in global crude oil prices, which hovers between USD30/barrel and USD40/barrel in June 2020. The headline inflat ion rate increased to 12.4% in May 2020, for the ninth consecutiv e months owing to supply constraints, higher input costs and increased Nigeria Bank Analysis | Public Credit Rating Page 3 system liquidity. To curtail inflationary pressures, FBN increMsed POe cMsO reserve requiremenP (âFRRâ) by 500 basis poi nts to 27.5% in January 2020, and has also recently released some policies to cushion the adverse impact of the COVID - 19 pandemic on the economy. These measures include, among others, a reduction in interest rates on all CBN intervention facilities to 5% f rom 9% (for one year with effect from 01 March 2020), and the cre ation of N50bn targeted credit facility to households and SMEs negatively affected by the pandemic. However, the pressures of the current macroeconomic challenges have resulted in the depreci ation of FX rate to N360/USD and N380/USD from N306.5/USD and N36 0CUSG MP POe officiMl RindoR Mnd HnvesPorsâ & ExporPersâ RindoR, respecPivelyB SimilMrly, POe external reserves declined to USD36.6bn at end - May 2020 from USD38.6bn as at 31 December 2019, wi th further contractions expected over the short term on account o f the relatively low FX earnings. Given that the Nigerian economy is heavily dependent on the oil sector, which has overtime accounted for over 90% of foreign exchange earnings and over 60% o f government budgetary revenues, the current dwindling global cru de oil price remains a major concern. In a bid to consolidate growth over the medium term, POe FederMl GovernmenP of NigeriM (âFGNâ) OMd maintained an expansionary policy, with a budget of N 10.59tn for 2020 fiscal year (2019: N8.92tn). The estimate was ba sed on an oil benchmark of USD57/barrel, a daily production output of 2.18mbpd, new value added tax rate of 7.5% (from 5% previously), inter alia. In light of the current macroeconomic challe nges, the FGN reviewed the oil benchmark downwards to USD28/barre l, daily production output to 1.8mbpd, while also indicating external borrowing plans to cushion the economic impact of the pandemic. GCR however, expects the continuing slowdown in economic activities to have significant implications for budget implementa tion and its already elevated credit risk profile. TOe NigeriMn SPock ExcOMnge (âNSEâ) All - Share Hndex (âASHâ) susPMined M negMPive Prend in 2020, contracting by 5.9% as at end - May 2020. Th e bearish stock market performance was largely driven by the chal lenges in the macroeconomic landscape, underwhelming trends in foreign portfolio investments as well as profit takings. Industry overview As part of measures to boost credit extension and st imulate lending to the real sector of the economy, CBN in July 20 19 issued a circular mandating Deposits Money Banks ("DMBs") to maintain an iniPiMl minimum loMn Po deposiPs rMPio (âIGRâ) of 60% by 30 September 2019 and subsequently reviewed to 65% with ef fect from 31 December 2019. According to CBN, failure to comply w ith this specification would attract an additional CRR of 50% to the lending shortfall of the target LDR. To allay concerns of a possible spike in the industry's NPLs, CBN in October 2019 gra nted DMBs' approval to directly debit bank accounts belonging to loan defaulters across all banks in the country, through bank verification number and in collaboration with the Nigeria Inter - Bank Settlement System Plc. While cognizance is taken of the posi tive economy impact of the minimum LDR, the increment of CRR to 2 7.5% (from 22.5%) could exert liquidity pressures on most banks within the short term, as well as constrain their earnings capacity. Furthermore, CBN during 2019 restricted domestic investors and non - bank corporates from participating in the Open Market Op eration (âOMOâ) insPrumenPsB TOis resPricPion OMs consequently led to a significant decline in yields on fixed - income securities, which currently trend below the average inflation rate. Bank ing sector recorded improvement in profitability in 2019, underpi
4 nned by growth in interest income on ac
nned by growth in interest income on account of expansion in loan book as well as fee and commission income as transactions volume on digital platforms increased. Per CBN statistics, total ba nking s ector assets stood firmer at N41 .9tn at end - December 2019 (December 2018: N37.2tn), while credit exposures increased by 12.6% to N22.3tn, as most banks sustained efforts to comply with the stipulated minimum LDR. The recorded expansion in loan portf olio coupled with the sustained resilience of the banking system sMR POe indusPryâs MverMge NPI rMPio moderated to 6.1% at end - December 2019 (December 2018: 11.6%), while CAR declined by 80 basis points year - on - year to 14.5%. The oil and gas remained the d ominant sector, accounting for over 30% of the Nigerian banking s ecPorâs crediP porPfolio MP end - December 2019. However, the slowdown in economic activities and the current challenges in the oil and gas sector (exacerbated by dwindling global crude oil pri ces) pose a significant credit risk to the banking sector and cou ld impact NPLs and profitability alike over the short term. To cushion this effect, CBN in March 2020, introduced a number of monetary policies, inter alia, include; extension of moratorium o n all regulatory intervention facilities; granting of regulatory forbearance on loans to businesses and households which are highly vulnerable to COVID - 19 pandemic. Statistics as at 31 December 2019 reveals that NigeriMâs finMnciMl secPor comprised PRenP y - two commercial banks, four financial holding companies, five me rchant banks, two non - interest banks, and over 4,000 other financial institutions. The commercial banks include eight international banks, eleven national banks, and three regional banks. Nig eriMâs five largest commercial banks accounted for over 70% of to PMl indusPryâs MssePs MP 31 GecemNer 201EB TOe competitive landscape of the Nigeria financial system remains stiff. This is further intensified by the issuance of operational licence to payme nt service Nigeria Bank Analysis | Public Credit Rating Page 4 banks (PSBs), financial technology companies (Fintechs ), and super agents to deepen financial inclusion through the provision of diversified financial services. Competitive position Wema ranks a mong the mid - tier banks i n Nigeria, with a market share of about 2 % based on indusPryâs total assets as at 3 1 December 2019 B WemMâs established position within the retail space in the highly competitive Nigerian banking industry is well noted. However , compared to other mid - sized banks, We ma lags peers in balance sheet size and profitability . TMNle 3 sOoRs POe NMnkâs key performance indicators against selected peers. Financial profile Likelihood of support Given th e rel ative ly small size of the bank within the Nigeria banking industry , su pport is limited to its shareholders . Funding composition Wema is mainly funded by customer deposits, comprising 84.3 % of the total funding at FY19 ( FY1 8 : 79.3%) . Other funding sources include equity ( 8.1 %) and borrowings ( 7.7 %). Details of each source o f funding are discussed below. Customer deposits Customer deposits rose significantly by 56.4 % to N577.3bn at FY19 , supported by the various innovations adopted by the bank (including digital platform) and the aforementioned decline in yield on fixed - income securiPies folloRing FBNâs resPricPion , ROicO OMs led domesPic invesPorsâ Po source for OigOer returns on investments during the year . Wema harnessed this opportunity by offering a s lightly higher rate to investors. Accordingly, term deposit dominated the NMnkâs deposiP mix MP FY1E, registering an 86.9 % growth and accounted for 61 % of total deposits at the balance sheet date . Current and savings deposits also grew by 28.9 % and 20.4 % ( reflecting the bank âs intensified deposit mobilisation effort s within th e retail banking space) and accounted for 22.8 % and 13.1 % respectively of the deposit book. Looking ahead, management hopes to achieve 4 % growth in customer deposits by FY20, as effor ts are being intensified to penetrate a number of state government for de posits. Table 2: Deposit book characteristics (%) By type Demand 22.8 Term 61.0 Savings 13.1 Others 3.1 Concentration Single largest 8.2 Ten largest 20.8 Five largest 16. 2 Twenty largest 27.3 Maturity 0 - 3 months 58.9 6 - 12 Months 6.1 3 - 6 Months 21.7 � 12 Mon
5 ths 13.4 Source: Wema AFS .
ths 13.4 Source: Wema AFS . The maturity profile of the deposit book is generally short, with the bulk ( 58.9 %) of the deposit li abilities maturing within three months . Concentration risk appears minim al, with the single and twenty largest depositor accounting for 8.2% and 27.3% of the deposit book at the balance sheet date. Capital and borrowings WemMâs PoPMl sOMreOoldersâ funds rose 8.4% to N55.2bn at FY19 (mainly fueled by internal capital gen eration and thus recording good buffer above the sPMPuPory minimum cMpiPMl requiremenP for POe NMnkâs license category) . However, this translated to a weakened risk weighted capital a dequacy ratio (âFARâ) of 13B6% (FY18: 18%) due Po M more elMsPic growth i n risk MssePsB Hence, mMnMgemenPâs plMns Po raise additional equity capital over the medium term to support capitalisation is considered appropriate. Table 4: Capitalisation FY1 8 FY1 9 N'bn N'bn Tier 1 capital 25.5 25.3 Tier 2 capital 8.6 8.5 Total re gulatory capital 34.1 33.9 Total risk weighted assets ("RWA") 189.5 248.9 Regulatory capital: RWA (%) 18.0 13.6 Source: Wema AFS. Outstanding borrowing s stood at N48.8bn a t FY19 , representing a year - on - year 7 .3 % growth . The breakdown of the lia bility pool at the balance sheet dMPe is sOoRn in TMNle DB TOe NMnkâ s borr owings comprise various credit facilities secured from financial institutions , including intervention funds Table 3: Competitive position* Ecobank U BN FCMB Sterling Wema Wema vs. selected b anks As at 31 December 2019 Shareholdersâ funds (Nâbn ) 264.3 245.8 175.1 119.6 55.2 Total assets (Nâbn)â 1,980.9 1,836.6 1,593.4 1,167.9 706.8 Net loans (Nâbn) 811.6 550.6 693.0 618 .7 289.2 Net profit after tax (Nâbn) 1.3 24.4 13.6 10.6 5.2 Total capital/Total assets (%) 12.8 15.3 15.3 13.9 11.3 Liquid and trading assets/total short - term funding (%) 31.8 50.3 20.3 26.9 32.5 Gross NPL ratio (%) 3.3 5.8 3.7 2.2 7.4 Net interest margin (%) 5.7 5.7 7.6 7.9 7 .0 Cost ratio (%) 76.6 74.5 70.3 8 1.2 74.3 ROaE (%) 13.3 10.5 9.8 9.8 9.8 ROaA (%) 1.5 1.5 1.1 0. 9 0.9 *Ranked by total assets. â Excludes balances held in respect of letters of credit. Source: Audited Financial Statem ents. Nigeria Bank Analysis | Public Credit Rating Page 5 g ranted by Nigerian government - owned financial institutions ( CBN and Devel opment Bank of Nigeria (âGBNâ) Mnd BMnk of HndusPry (âBOH â) ) under its agriculture, m icro, small and medium scale enterprise and manufacturing sectors special intervention funds for o n - lending to qualifie d customers . Table 5: Borrowings FY1 8 FY1 9 N'm N ' m Qualifying Tier 2 capital 24,676.3 24,705.9 Wema SPV 24,676.3 24, 705.9 Other borrowings 20,772.3 24,064.5 National Housing Fund 93.6 83.6 CBN MSMEDF 1,000.1 572.2 BOI 2,776.5 2, 001.8 CBN Agricultural loan 825.2 1,945.2 Shelter Afrique 2,938.3 2, 0 25.1 AFDB 5,639.4 4 ,920.9 ICD 7,493.8 - DBN 5.4 12,515.7 Total 45,448.6 48,770.4 Source: Wema AFS. Also included in POe NMnkâs Nor rowings is a fixed rate unsecured bond issued by Wema Funding SPV during 2 016 and 2018 respectively, which qualifies as Tier 2 capital . Liquidity positioning WemMâs liquidiPy posiPion was under pressure , as the bank record ed a shortfall in th e statutory liquidity ratio below the minimum requirement at some point during FY 19 (recording lowest ratio of 23.5%), albeit normalising at year end at 32.4%. Furthermore, matching of POe NMnkâs MsseP Mnd liMNiliPy mMPuriPies MP NMlMnce sheet date shows a negative cumulative liquidity gap across all maturity bands. The contractual liq uidity gap in POe âless POMn POree monPOsâ mMPuriPy NuckeP sPood MP N201.1bn (2.5 times of capital) . Nonetheless, the behavioral trend in the Nigerian banking spac e indicates that a significant portion of deposits are usually rolled over at maturity , offers s ome comfort regarding liquidity risk severity. Table 6: Net liquidity gap profile (N'bn) month s 3 - 6 months 6 - 12 months �1 year Assets 189.8 48.5 144.1 149.8 Liabilities ( 390.9 ) ( 130.3 ) ( 44.7 ) ( 86.0 ) Net liquidity gap ( 201.1 ) (81.8) 9 9.4 63.8 Cumulative
6 liquidity gap ( 201.1 ) ( 282.9 )
(
282.9
)")
liquidity gap ( 201.1 ) ( 282.9 ) ( 183.5 ) ( 119.7 ) Source: Wema AFS. Operational profile Risk management Wema âs risk mMnMgemenP frMmeRork is set up on established policies to guide in the process of ident ifying, analysing, managing an d monitoring the various risk inherent in the activities of the bank, as well as setting appropriate risk limits and controls to align the risks with the strate gic objectives. The board is responsible for the overall risk management of the bank. These func tions are performed through board committees, which are assisted by management committees. The bank has in place a full compliance unit, aimed at ensuring adhe rence to the credit approval process, as well as credit monitoring and supervision . Asset comp osition WemMâs asset base expanded by 46 % to N 706.8 bn at FY19 and ended up at N 776.1 bn at 1Q FY20, fuelled by increased funding . A review of the a sset mix show s a strong increase of 178.4 % in cash and liquid assets, which constituted a higher 42.6% of the enlarged asset base. While net loans and advances increased by 14.7% in absolute term , it constituted a lower 40.9% of total assets at FY19, given the quan tum of increase in other components of the balance sheet. Table 7 : Asset Mix FY1 8 F Y19 N'bn % N'bn % Cash and liquid assets 108.2 22.3 301.2 42.6 Cash 17.1 3.5 20.6 2.9 Liquidity reserve deposits 58.1 12.0 137.4 19.4 Treasury bills and bonds 12.6 2 .6 107.0 15.1 Balances with other banks 20.4 4.2 36.3 5.1 Customer advances 252.2 52.1 289.2 4 0.9 Other investment securities 59.0 12.2 43.1 6.1 Property, plant and equipment 18.6 3.8 20.6 2.9 Other assets 46.2 9.5 52.5 7.4 Total 484.2 100.0 706.8 10 0.0 Source: Wema AFS. On the other hand, POe NMnkâs invesPmenP securiPies ( comprised treasury bills and bonds ) declined 26.9 % and accounted for a lower 6.1 % of the asset base at the balance sheet date . Loan portfolio Gross loans and advances rose 15.2 % to N 301.3 bn at FY 19 . The bank possesses a relatively diversified credit portfolio, with no se ctor exposure exceeding 20% of the book at the balance sheet date. Table 8 : Loan book characteristics (%) By Sector: Agriculture 3. 9 Manufacturing 5 .6 Oil & gas 19.2 Real estate 7.5 Construction 14. 1 Transport 8 .0 General commerce 16. 6 General 8.7 Public sector 5.7 Others 10.9 Concentration : Maturity : Single largest 4.4 0 - 3 month s 27.7 Five largest 17.0 3 - 12 months 34.0 Ten large st 29. 5 � 12 months 38.3 Twenty largest 46.6 Product type: Term loans 9.1 Others 1.4 Ove rdrafts 89.5 Source: Wema AFS. Furthermore, concentration risk by obligor is considered moderate, with the single largest obligor accounting for 4. 4 % and 16 .4 % of gross loans and sOMreOoldersâ funds respecPively, ROile POe PRenPy largest obligors repre sented 46.6 % of the book. The maturity profile of the loan book is short - dated , with 61.7 % of the exposures maturing within one year. Nigeria Bank Analysis | Public Credit Rating Page 6 Going forward, given the current macroeconomic environment characteri s ed by the decline in crude oil price and COVID - 19 pandemic, management intends to shift lending focus to sectors perceived to be resilient. The bank has however projected a growth of about 12.4 % in loan book fo r FY 20 , w hile still maintaining its stance on quality exposures. C ontingencies Off - balance she et commitments increased by 3 3 .3 % to N 83.9 bn at FY1 9 , equivalent to 105% of the total capital at FY19 (FY18: 83.3%). These comprised; guarantee and indemnities ( 80.6 %) , bonds ( 4. 7 % ) , and clean - line facilities and irrevocable letter s of credit ( 14.7 %) . As set quality Rapid loan growth impacted negatively on asset qualit y in FY19. NPL rose by 70.8% to N22.2bn , translating to a weaker gross NPL ratio of 7.4% at FY19 (FY18: 5% ). Further concerning is the decline in total arrears coverage ratio to 5 4.5%, down from 72.3% at FY18 . However, management expects its strict loan selection process, and a more aggressive approach in managing stressed loans to minim ise the risk of further deterioration in asset quality on account of the prevailing inclement operating environment . Table 9 : Asset Quality F Y 1
7 8 F Y1 9 N'bn N'bn Gross Advanc
8 F Y1 9 N'bn N'bn Gross Advances 261.6 301.3 Performing 248.6 279.1 Impaired 13.0 22.2 Provision for impairment (9.4) (12.1 ) 12 - month ECL (5.5 ) (7.1 ) Lifetime ECL not credit - impa ired - (0.4) Lifetime ECL credit - impaired (3.9 ) (4 .6) Net NPLs 3.6 10.1 Selected asset quality ratios: Gross NPLs ratio (%) 5.0 7.4 Net NPLs rati o (%) 1.4 3 .4 Net NPLs/Capital (%) 4.8 12.6 Source: Wema AFS . Financial performance A five year financial synopsis together with three months unaudited results to 31 March 2020, is presented on page 7 of this report, supplemented by the commentary be low. Th e bank maintained an upward trajectory in profitability over the last three years, attaining a review period high of N6.8bn in FY19. Performance in FY19 was support ed by n on - interest income , which grew 74.2% to N24.2b n (buoyed by growth in securities trading). Notwithstanding the notable rise in operating expenses (largely staff cost related) cost ratio declined to 74.3% in FY1 9 (FY18 : 7 9.7 %). Accordingly, return on average equity and assets (â ROMEâ and âROMAâ ) improved to 9.8% and 0.9% in FY19 from 6.6% and 0.8% in prior year respectively. Table 10: Budget vs. interim results (N â bn) Actual FY1 9 Budget FY 20 Actual 1 Q FY 20 % of budget * FY 2 0 Income statement Net interest income 26.0 31.0 6.7 86. 5 Other income 24.2 19.8 3 .9 78.8 Total income 50.2 50.8 10.6 83.5 Impairment charge ( 6.1 ) (7.5) (0. 6 ) 32.0 OPEX ( 37.3 ) (38.3) ( 8.9 ) 93.0 NPBT 6.8 5.0 1.1 88.0 Balance sheet Customers deposits 577.3 600.0 596.4 99.4 Net advances 289.2 325.0 313.8 96.6 Total assets 706.8 733.5 776.1 10 5.8 Tier 1 capital 55.2 56.9 56.1 98.6 *Annualised Source: Wema . Per management, t he current macroeconomic dyn amics ha ve been considered in drawing up the revised budget. As such, a 26.5 % decline at the pre - tax profit level was forecast , which is to be driven by income growth . H owever, for the t hree - month period e nding 3 1 March 20 20 , the bank delivered a pre - tax profit of N 1.1 bn, translating to 88 % of the budget on a nnualised basis . Nevertheless, management remains optimistic that the recorded unfavorable variance in performance would be offset in the remaining p eriod of the year based on various initiatives put in place. Nigeria Bank Analysis | Public Credit Rating Pag e 7 Nigeria Bank Analysis | Public Credit Rating Pag e 8 SALIENT FEATURES OF ACCORDED RATINGS GCR affirms that a.) no part of the rating was influenced by any other business activities of the credit rating agency; b.) the rating was based solely on the merits of the rated entity, security or fi nancial instrument being rated; c.) such rating was an independent evaluation of the risks and merits of the rated entity, security or financial inst rument ; and (d) the validity of the rating is for a maximum of 12 months, or earlier as indicated by the ap plicable credit rating document. The ratings were solicited by, or on behalf of, Wema Bank Plc , and therefore, GCR has been compensated for the prov ision of the ratings. Wema Bank Plc participated in the rating process via face - to - face management meeting s, teleconferences and other written correspondence. Furthermore, the quality of info rmation received was considered adequate and has been independen tly verified where possible. The credit ratings above were disclosed to Wema Bank P lc with no contestation of/changes to the ratings. The information received from Wema Bank Plc and other reliable third parties to accord the credit rating included the la test audited annual financial statements as at 31 December 201 9 (plus four years of audited comparative num bers), latest internal and/or external audit report to management, full year detailed budgeted financial statements for 20 20 , most recent year - to - dat e management accounts to 31 March 20 20 reserving methodologies and capital management policies. In addition , information specific to the rated entity and/or industry was also received . ALL GCR CREDIT RATINGS ARE SUBJECT TO CERTAIN LIMITATIONS, TERMS OF USE OF SUCH RATINGS AND DISCLAIMERS. PLEASE READ THESE LI
8 MITATIONS, TERMS OF USE AND DISCLAIMERS
MITATIONS, TERMS OF USE AND DISCLAIMERS BY FOLLOW ING THIS LINK: HTTP://GLOBALRATINGS.COM.NG/UNDERSTANDING - RATINGS . IN ADDITION, RATI NG SCALES AND DEFINITIONS ARE AVAILABLE ON GCRâS PUBLIC WEB SITE AT HTTP://GLOBALRATINGS.COM.NG/RATINGS - INFO/RATING - SCALES - DEFINITIONS . PUBLISHED RATINGS, CRITERIA, AND METH ODOLOGIES ARE AVAILABLE FROM THIS SITE AT ALL TIMES. GCR'S CODE OF CONDUCT, CONFIDENTIALITY, CONFLICTS OF I NTEREST, COMPLIANCE, AND OTHER RELEVANT POLICIES AND PROCEDURES ARE ALSO AVAILABLE FROM THE UNDERSTANDING RATINGS SECTION OF THIS SITE. CREDIT RATI NGS ISSUED AND RESEARCH PUBLICATIONS PUBLISHED BY GCR, ARE GCRâS OPINIONS, AS AT THE DATE OF ISSUE OR PUBLI CATION THEREOF, OF THE RELATIVE FUTURE CREDIT RISK OF ENTITIES, CREDIT COMMITMENTS, OR DEBT OR DEBT - LIKE SECURITIES. GCR DEFINES CREDIT RISK AS THE R ISK THAT AN ENTITY MAY NOT MEET ITS CONTRACTUAL AND/OR FINANCIAL OBLIGATIONS AS THEY BECOME DUE. CREDIT RAT INGS DO NOT ADDRESS ANY OTHER RISK, INCLUDING BUT NOT LIMITED TO: FRAUD, MARKET LIQUIDITY RISK, MARKET VALUE RISK, OR PRICE VOLATILITY. CREDIT RATING S AND GCRâS OPINIONS INCLUDED IN GCRâS PUBLICATIONS ARE NOT STATEMENTS OF CURRENT OR HISTORICAL FACT. CREDI T RATINGS AND GCRâS PUBLICATIONS DO NOT CONSTITUTE OR PROVIDE INVESTMENT OR FINANCIAL ADVICE, AND CREDIT RATINGS AND GCRâS PUBLICATIONS ARE NOT AND D O NOT PROVIDE RECOMMENDATIONS TO PURCHASE, SELL OR HOLD PARTICULAR SECURITIES. NEITHER GCRâS CREDIT RATINGS , NOR ITS PUBLICATIONS, COMMENT ON THE SUITABILITY OF AN INVESTMENT FOR ANY PARTICULAR INVESTOR. GCR ISSUES ITS CREDIT RATINGS AND PUBLISHES GCRâS PU BLICATIONS WITH THE EXPECTATION AND UNDERSTANDING THAT EACH INVESTOR WILL MAKE ITS OWN STUDY AND EVALUATION OF EACH SECURITY THAT IS UNDER CONSIDERATION FOR PURCHASE, HOLDING OR SALE. Copyright © 20 20 Global Credit Rating Co mpany L imite d. THE INFORMATION CONTAINED HEREIN MAY NOT BE COPIED OR OTHERWISE REPRODUCED OR DISCLOSED , IN WHOLE OR IN PART, IN ANY FORM OR MANNER OR BY ANY MEANS WHATSOEVER, BY ANY PERSON WITHOUT GCRâS PRIOR WRITTEN CONSENT. The ratings were solicited by, or on behalf of, the issuer o f the instrument in respect of which the rating is issued, and GCR has been compensated for the provision o f the ratings. Information sources used to prepare the ratings are set out in each credit rating report and/or rating notification and include the fo llowing: parties involved in the ratings and public information. All information used to prepare the rating s is obtained by GCR from sources reasonably believed by it to be accurate and reliable. Although GCR will at all times use its best efforts and prac tices to ensure that the information it relies on is accurate at the time, GCR does not provide any warrant y in respect of, nor is it otherwise responsible for, the accurateness of such information. GCR adopts all reasonable measures to ensure that the inf ormation it uses in assigning a credit rating is of sufficient quality and that such information is obtaine d from sources that GCR, acting reasonably, considers to be reliable, including, when appropriate, independent third - party sources. However, GCR cann ot in every instance independently verify or validate information received in the rating process. Under no circumstances shall GCR have any liability to any person or entity for (a) any loss or damage suffered by such person or entity caused by, resulting from, or relating to, any error made by GCR, whether negligently (including gross negligence) or otherwise, or other circumstance or contingency outside the control of GCR or any of its directors, officers, employees or agents in connection with the procur ement, collection, compilation, analysis, interpretation, communication, publication or delivery of any suc h information, or (b) any direct, indirect, special, consequential, compensatory or incidental damages whatsoever (including without limitation, lost profits) suffered by such person or entity, as a result of the use of or inability to use any such informa tion. The ratings, financial reporting analysis, projections, and other observations, if any, constituting part of the information contained herein a re, and must be construed solely as, statements of opinion and not statements of fact or recommendations to purchase, sell or hold any securities. Each user of the information contained herein must make its own study and evaluation of each security it may consider purchasing, holding or selling. NO WARRANTY, EXPRESS OR IMPLIED, AS TO THE ACCURACY, TIMELINESS, C OMPLETENESS, MERCHANTABILITY OR FITNESS FOR ANY PARTICULAR PURPOSE OF ANY SUCH RATING OR OTHER OPINION OR INFORMATION IS GIVEN OR MADE BY GCR IN ANY FORM OR MANNER WHATSOEV