
Guo Z Wang Z Zhang S Li X Li L Li C et al Aerosol and Surface Distribution of Severe Acute Respiratory Syndrome Coronavirus 2 in Hospital Wards Wuhan China 2020 Emerg Infect Dis 202026715831591 httpsdoiorg103201eid2607200885 ID: 1033422
Download Presentation The PPT/PDF document "Figure 2 Figure 2. Spatial distribution ..." is the property of its rightful owner. Permission is granted to download and print the materials on this web site for personal, non-commercial use only, and to display it on your personal computer provided you do not modify the materials and that you retain all copyright notices contained in the materials. By downloading content from our website, you accept the terms of this agreement.


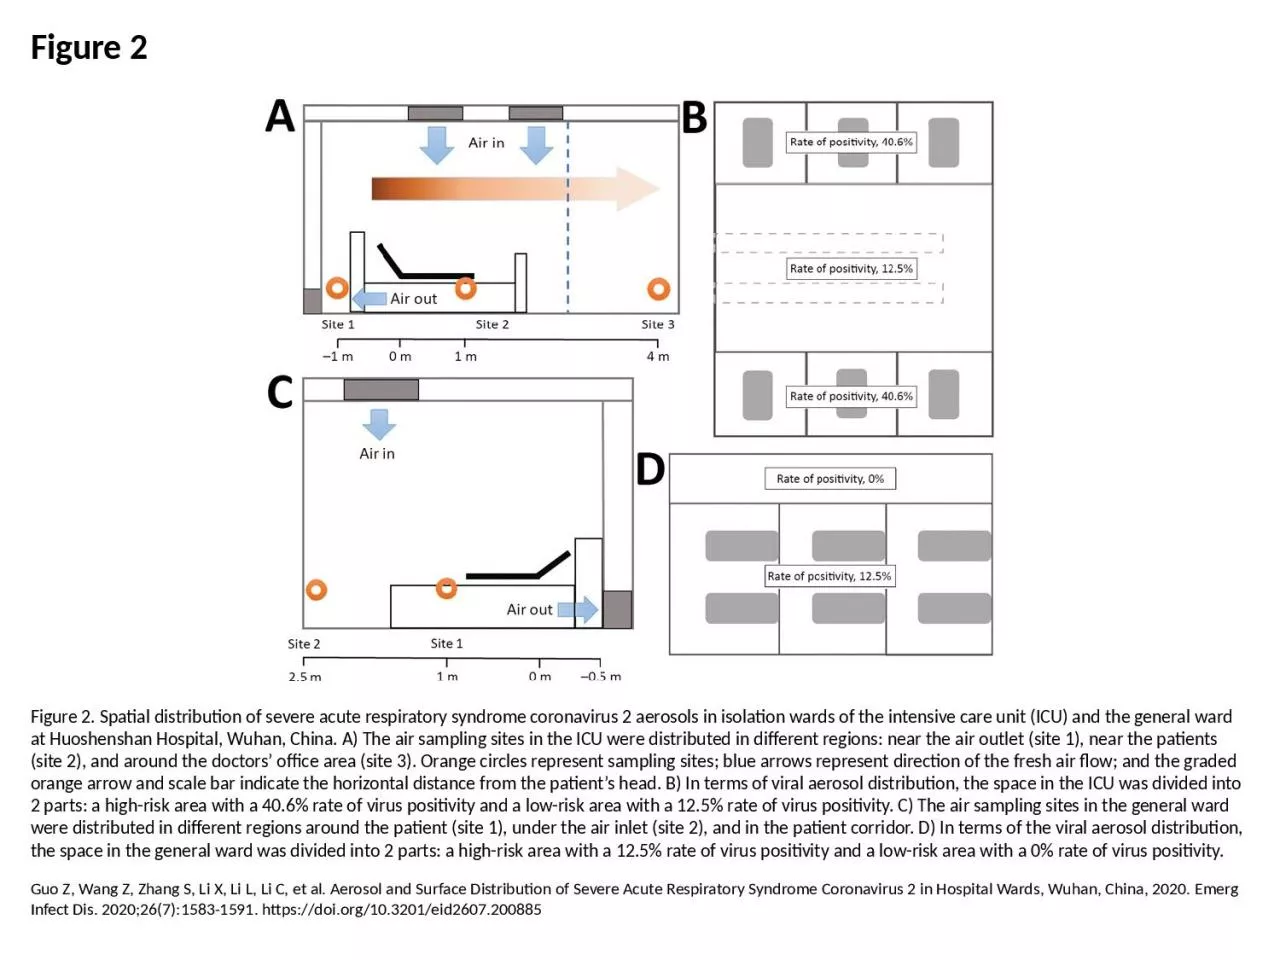
1. Figure 2Figure 2. Spatial distribution of severe acute respiratory syndrome coronavirus 2 aerosols in isolation wards of the intensive care unit (ICU) and the general ward at Huoshenshan Hospital, Wuhan, China. A) The air sampling sites in the ICU were distributed in different regions: near the air outlet (site 1), near the patients (site 2), and around the doctors’ office area (site 3). Orange circles represent sampling sites; blue arrows represent direction of the fresh air flow; and the graded orange arrow and scale bar indicate the horizontal distance from the patient’s head. B) In terms of viral aerosol distribution, the space in the ICU was divided into 2 parts: a high-risk area with a 40.6% rate of virus positivity and a low-risk area with a 12.5% rate of virus positivity. C) The air sampling sites in the general ward were distributed in different regions around the patient (site 1), under the air inlet (site 2), and in the patient corridor. D) In terms of the viral aerosol distribution, the space in the general ward was divided into 2 parts: a high-risk area with a 12.5% rate of virus positivity and a low-risk area with a 0% rate of virus positivity.Guo Z, Wang Z, Zhang S, Li X, Li L, Li C, et al. Aerosol and Surface Distribution of Severe Acute Respiratory Syndrome Coronavirus 2 in Hospital Wards, Wuhan, China, 2020. Emerg Infect Dis. 2020;26(7):1583-1591. https://doi.org/10.3201/eid2607.200885