
Median PFS 14 months 95 CI 1216 Median PFS 12 months 95 CI 047 A B C Cancer Prior to TAS117 n13 TAS117 n13 Subsequent line of treatment n6 Breast cancer 3 ID: 1033176
Download Presentation The PPT/PDF document "Median PFS: 2.6 months (95% CI, 1.7-3.5)" is the property of its rightful owner. Permission is granted to download and print the materials on this web site for personal, non-commercial use only, and to display it on your personal computer provided you do not modify the materials and that you retain all copyright notices contained in the materials. By downloading content from our website, you accept the terms of this agreement.


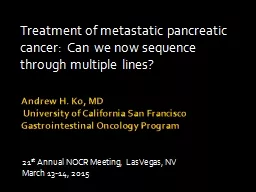
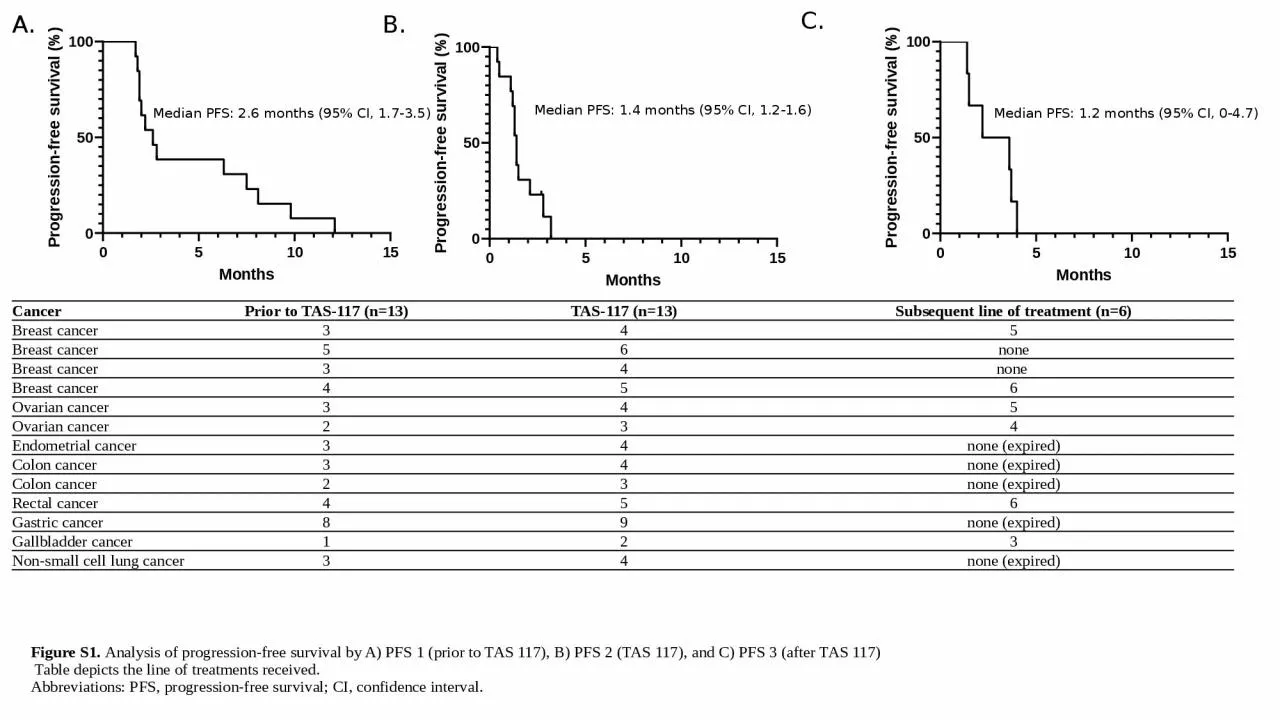
1. Median PFS: 2.6 months (95% CI, 1.7-3.5)Median PFS: 1.4 months (95% CI, 1.2-1.6) Median PFS: 1.2 months (95% CI, 0-4.7) A.B.C.Cancer Prior to TAS-117 (n=13)TAS-117 (n=13)Subsequent line of treatment (n=6)Breast cancer 345Breast cancer 56noneBreast cancer 34none Breast cancer 456Ovarian cancer345Ovarian cancer234Endometrial cancer 34none (expired)Colon cancer34none (expired)Colon cancer23none (expired)Rectal cancer456Gastric cancer89none (expired)Gallbladder cancer123Non-small cell lung cancer34none (expired)Figure S1. Analysis of progression-free survival by A) PFS 1 (prior to TAS 117), B) PFS 2 (TAS 117), and C) PFS 3 (after TAS 117) Table depicts the line of treatments received. Abbreviations: PFS, progression-free survival; CI, confidence interval.
2. p= 0.107Figure S2. Analysis of responses per metastatic organs by one-way analysis of variance (ANOVA)There was no significant difference in progression in all organs (p = 0.076) and in the lymph nodes and liver (p = 0.107). Other metastatic organs included: 1) soft tissue around the peri-aortic area, 2) inguinal mass, 3) pelvic cavity mass, 4) seeding nodule in the anterior renal fascia, and 5) spleen.Abbreviations: LN, lymph nodes.
3. Figure S3. Co-existing mutations identified in patients treated with TAS-117A total of 22 mutations were identified in 13 patients. TP53 mutations (n = 7) were the most common.Abbreviations: TP-53, tumor protein 53; APC, adenomatous polyposis coli; KRAS, Kirsten rat sarcoma viral oncogene homolog; ERBB2, Erb-B2 receptor tyrosine kinase 2; CDH1, Cadherin 1; BRAF, B-Raf proto-oncogene; FGFR, fibroblast growth factor receptors; TERT, telomerase reverse transcriptase; ARID-1A, AT-rich interactive domain-containing protein 1A; NRAS, neuroblastoma ras viral oncogene homolog.
4. A.B.C.D.p= 0.526p= 0.512p=0.978 p= 0.68Figure S4. Co-existing mutations categorized according to A) primary or metastatic biopsy site, B) biopsy time period (at initial cancer diagnosis or prior to TAS-117 treatment), C) response evaluation by RECIST criteria (PR, SD, PD), and D) tumor typesThere are no correlations between co-existing mutations.Abbreviations: RTK, receptor tyrosine kinase; RAS-RAF-MAPK, Ras-Raf-Mitogen-activated protein kinase; PR, partial response; SD, stable disease; PD, progressive disease; RECIST, response evaluation criteria in solid tumors; NSCLC, non-small cell lung cancer
5. Figure S5. Relative dose intensity of TAS-117