
B R Weatherford and E V Barnat Sandia National Laboratories Z Xiong and M J Kushner University of Michigan Fast Ionization Waves FIWs Nanosecond duration overvoltage gt breakdown ID: 598853
Download Presentation The PPT/PDF document "2-D Electron and Metastable Density Prof..." is the property of its rightful owner. Permission is granted to download and print the materials on this web site for personal, non-commercial use only, and to display it on your personal computer provided you do not modify the materials and that you retain all copyright notices contained in the materials. By downloading content from our website, you accept the terms of this agreement.


Slide1
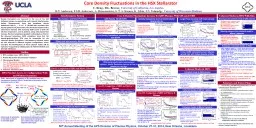
2-D Electron and Metastable Density Profiles Produced in Helium FIW Discharges
B. R. Weatherford and E. V. BarnatSandia National LaboratoriesZ. Xiong and M. J. KushnerUniversity of MichiganSlide2
Fast Ionization Waves (FIWs)
Nanosecond-duration, overvoltage (> breakdown) E-fields Diffuse volume discharge at elevated pressuresHigh-energy electrons efficiently drive inelastic processes
Ideal for large volume, uniform, high pressure production of:Photons
Charged particlesExcited speciesProposed Applications:
Pulsed UV light sources / laser pumpingHigh-pressure plasma chemistry
Plasma-assisted combustion
Runaway electron generation
2Slide3
Current Understanding of FIWs
Axial FIW propagation studied extensivelyCapacitive probes Average E-fields, e-
densityOptical emission 2-D profiles, wave speeds
Laser diagnostics Spatially resolved
E-fields
Radial variations important, but still unclear
Varying
E
-field? Higher density or T
e
? Photons?Applications may require volume uniformityWhat do profiles tell us about the physics?
3
Increasing Pressure
Vasilyak (1994)
Takashima (2011)
Positive Polarity
Negative Polarity
Helium FIW, 20 Torr, 11 kVSlide4
Experimental Setup - Chamber
Discharge Tube: 3.3 cm ID x 25.4 cm longHV electrode inside Teflon sleeve, grounded shield
Imaged area: 20-140 mm from ground electrode
Helium feed gasPressure 1-20 Torr
~14 kV (open load) +HV pulses20 ns duration, 3 ns rise time
1 kHz pulse rep rate
4Slide5
2-D LCIF Diagnostic Scheme
2-D maps of electron densities acquired from helium line intensity ratiosPump 2
3S metastables to 33
P with 389 nm laserElectron collisions transfer from 3
3P
3
3
D
Image LIF @ 389 nm (3
3
P-23
S) and LCIF @ 588 nm (33D-2
3P) after the laser pulse
Ratio depends linearly on e- density
5
Barnat (2009)Slide6
Electron Densities vs. Pressure
Density maps @ fixed rep rate & voltage, 1-16 TorrICCD delay time: 100 ns after FIW, 20 ns windowPeak densities on scale of 1011 cm-3 for all pressuresLow P
center-peakedHigh P wall-peaked
Max uniformity, ne at intermediate pressure
6
Wavefront Motion
Increasing Pressure
Key Questions:
What causes the transition in e
-
densities?
Can we explain this with a model?Slide7
Metastable Densities vs. Pressure
Helium 23S metastable profiles, 1-16 TorrRelative densities from LIF intensitiesLaser absorption measurements for calibration (B. Yee)Same general trends, but less drastic than
neCenter-peaked to volume-filling / uniform
Similar FIW decay lengths
7
Wavefront Motion
Increasing PressureSlide8
Simulation Results - nonPDPSIM
2-D fluid simulationPhoton transportStepwise ionizationPlasma chemistryEEDF calculated from two-term expansion of Boltzmann equation
Same voltage pulse shape as in experiment
Simulations produce similar results as LCIFN
e ~ 1011
-10
12
cm
-3
Trend in radial profiles with variable pressure
Wave velocities ~ cm/ns
8
1 Torr Profiles
16 Torr Profiles
(Xiong and Kushner)Slide9
Electrons vs. Metastables
9
Experiment: n
e
, N
He*
have different radial profiles @ high pressure
Metastables shifted to center
Model: n
e
, NHe* track each other
Model results rule out:Volume photoionizationPhotoelectrons from wall
n
e
16 Torr Profiles - Simulation
N
He*
Key Questions:Why are these profiles different?
What does this say about FIW physics?He* Profiles - Experiment
(Behind wavefront)
n
e
N
He
*
Top: Experiment
Bottom: SimulationSlide10
E
-field, Effective Te Distributions
10
Simulations
Strong radial
E
near wall
Exceeds runaway e- threshold (~210 Td in He)
Radial
E
exceeds axial E
in and behind FIW front1 Torr: Mean e- energy nearly uniform
E-field fills much of the volume
16 Torr: Mean e-
energy highest at wallE-field drops rapidly away from wall
Electrons cool via collisions
16 Torr – Te and E
1 Torr – Te and E
Axis
Axial & Radial
E
, 16 Torr
Inside wavefront
Wall
Axial & Radial
E
, 16 Torr
Behind wavefront
Axis
WallSlide11
Effect of Runaway Electrons
σiz peaks near 150 eV,
σHe*
at 30 eVRadial fast e- flux in cylindrical geometry
competing processes:Focusing of e
-
flux, scales as 1/r
Loss of “fast” flux via inelastic collisions
Cooling of fast electrons via elastic collisions
1-D production profiles estimated due to radial runaway e
-
flux from wall
11
Electron cooling
separated
e-
and He* profiles
Fixed energy vs.
r
captures pressure trend
Ionization, 2
3
S Cross-sections
30 eV e-, constant energy
4 Torr, with collisional cooling
Initial EnergiesSlide12
Summary
2-D maps of electron and 23S metastable densities in a positive polarity He FIW measured using LCIF/LIFCenter-peaked ne
at low pressure, wall-peaked at high pressureMetastable profiles shift from center-peaked to volume-filling
Intermediate pressures highest densities and uniformity
2-D fluid simulations capture similar trends in n
e
Peak e- densities of 10
11
-10
12
cm-3; shift in radial profiles
Predicts metastable distributions which track e- densities
Radial E-fields yielding runaway e
- may explain the difference
Runaway electrons are difficult to capture in fluid modelDropoff in
E at high pressure fast e
- from walls lose energy
High energy ionization; Lower energy metastable productionEnergy decay along radius causes spatial separation in profiles
12Slide13
Thank you!
Questions?Comments?This work was supported by the Department of Energy Office of Fusion Energy Science Contract DE-SC0001939.
13