

18 Learning Objectives Discuss the difference between traditional costing and activitybased costing Apply activitybased costing to a manufacturer Explain the benefits and limitations of activitybased costing ID: 462589
Download Presentation The PPT/PDF document "Activity-Based Costing" is the property of its rightful owner. Permission is granted to download and print the materials on this web site for personal, non-commercial use only, and to display it on your personal computer provided you do not modify the materials and that you retain all copyright notices contained in the materials. By downloading content from our website, you accept the terms of this agreement.


Slide1Slide2
Activity-Based Costing
18
Learning Objectives
Discuss the difference
between traditional
costing and
activity-based costing
.
Apply activity-based costing to
a manufacturer.
Explain the
benefits and limitations of activity-based costing.
3
Apply activity-based costing to service industries.
2
1
4Slide3
Allocates overhead using a
predetermined
rate
.Job order costing
: direct labor cost may be the relevant activity base.Process costing
: machine hours may be the relevant activity base.
Traditional Costing Systems
LEARNINGOBJECTIVEDiscuss the difference between traditional costing and activity-based costing
.1
LO
1
Illustration 18-1
Traditional one-stage
costing systemSlide4
Atlas Company produces two abdominal fitness products—the Ab Bench and the Ab Coaster. The direct materials cost per unit is $40 for the Ab Bench and $30 for the
Ab Coaster. The
direct labor cost is $12 per unit for each product
. Both products require one direct labor hour per unit, both products are allocated overhead cost of $30 per unit.
Illustration
18-3
Total unit
costs—traditional costingIllustration of a Traditional Costing System
LO
1Slide5
Tremendous change in manufacturing and service industries.
Decrease in amount of direct labor usage.
Significant increase in total overhead costs.
Inappropriate to use
plantwide
predetermined overhead rates when a lack of correlation exists.
Complex manufacturing processes may require multiple allocation bases; this approach is called
activity-based costing (ABC).
The Need for a New Approach
LO
1Slide6
An
approach for allocating overhead costs.
Allocates
overhead to multiple activity cost
pools.
Assigns the activity cost pools to products or services by means of cost drivers.
Activity-Based Costing
LO
1Slide7
2. Identify the cost driver that has a strong correlation to the costs accumulated in each cost pool.
Activity-Based Costing
(Four Steps)
1. Identify and classify the activities involved in the manufacture of specific products and assign overhead to cost pools.
3. Compute the activity-based overhead rate for each cost pool.
4. Allocate overhead costs to products using the overhead rates determined for each cost pool.
LO
1Slide8
ABC allocates overhead
in a two-stage process:
Stage 1:
Overhead costs are assigned to activity cost pools (Step 1).
Stage 2:
Allocates overhead assigned to the activity cost pools to
products, using cost drivers (Steps 2-4).
The more complex a product’s manufacturing operation, the more activities and cost drivers are likely to be present.
Activity-Based Costing
LO
1Slide9
Illustration 17-2
Activities and related cost drivers
Illustration 18-5
Activities and related
cost drivers
LO
1Slide10
Solution:
1.
False
. 2.
True.
3. True. 4. False. 5. True.
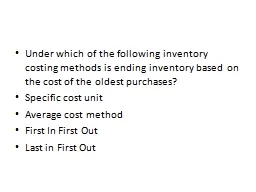
Indicate whether the following statements are true or false.
A traditional costing system allocates overhead by means of multiple overhead rates.
Activity-based costing allocates overhead costs in a two-stage process.
Direct material and direct labor costs are easier to trace to products than overhead.As manufacturing processes have become more automated, more companies have chosen to allocate overhead on the basis of direct labor costs.In activity-based costing, an activity is any event, action, transaction, or work sequence that incurs cost when producing a product.
1
Costing Systems
LO
1Slide11
Activity-Based Costing
Involves the following
four steps
.
Identify and classify the activities
involved in the manufacture of specific
products
and assign overhead to cost pools.Identify the cost driver
that has a strong correlation to the costs accumulated in each cost pool.Compute the activity-based overhead rate for each cost pool.
Allocate overhead costs to products, using the overhead rates determined for each cost pool.
LEARNING
OBJECTIVEApply activity-based costing to a manufacturer.
2
LO
2Slide12
Overhead
costs are assigned directly to the appropriate activity cost pool.
Identify and Classify Activities and Allocate Overhead to Cost Pools (Step 1)
Illustration 18-6
Activity cost pools
and estimated
overhead
LO
2Slide13
Cost driver must accurately measure
the actual consumption of the activity by the various products.
Illustration 18-7:
Cost drivers that Atlas Company identifies and their total expected use per activity cost pool.
Illustration 18-7
Identify Cost Drivers (Step 2)
LO
2Slide14
Illustration 18-8
Illustration 18-9
Next
, the company computes an
activity-based overhead rate
per cost driver.
Compute Activity-Based Overhead Rates (Step 3)
LO
2Slide15
In
allocating
overhead costs, it is necessary to know the expected use of cost drivers
for each product
.
Because of its low volume and higher number of components, the Ab Coaster requires more setups and purchase orders than the
Ab Bench.
Illustration 17-8 Allocate Overhead Costs to Products (Step 4)
Illustration 18-10
Expected use of cost
drivers per
product
LO
2Slide16
Illustration 18-11
Allocation of activity cost pools
to products
To
allocate
overhead costs
, Atlas multiplies the activity-based overhead rates per cost driver (Ill. 18-9) by the number of cost drivers expected to be used per product (Ill. 18-10).
LO
2
Allocate
Overhead Costs to Products (Step 4)Slide17
Illustration 18-11
LO
2
To
allocate
overhead
costs
, Atlas multiplies the activity-based overhead rates per cost driver (
Ill. 18-9) by the number of cost drivers expected to be used per product (Ill. 18-10).
Allocate
Overhead Costs to Products (Step 4)Slide18
Likely
consequence of
differences
in assigning
overhead.
Overpricing
the Ab Bench
and possibly losing market share to competitors. Sacrificing profitability by underpricing the Ab Coaster.
Illustration 17-10
Comparing Unit Costs
Illustration 18-12
Comparison of unit
product costs
LO
2Slide19
ABC Evaluated
Surveys
of
companies often show
ABC
usage of approximately 50%. Yet, in recent years,
articles about ABC have expressed mixed opinions regarding its usefulness. To evaluate ABC practices and user satisfaction with ABC, a survey was conducted of
348 companies worldwide. Some of the interesting findings included the following: ABC methods are widely used across the entire value chain, rather than being primarily used to allocate production-specific costs; only 25% of non-ABC companies think they are accurately tracing the costs of activities, while 70% of ABC companies think their company does this well; and respondents felt
that ABC provides greater support for financial, operational, and strategic decisions. More than 87% of respondents said that their ideal costing system would include some
form of ABC. Since this significantly exceeds the 50% of the respondents actually using it, ABC usage may well increase
in the future. Source
: William Stratton, Denis Desroches, Raef Lawson, and Toby Hatch, “Activity-Based Costing: Is It Still Relevant?” Management Accounting Quarterly (Spring, 2009), pp. 31–39.
Management Insight
LO
2Slide20
2
Apply ABC to Manufacturer
Casey Company has five activity cost pools and two products. It expects to produce 200,000 units of its automobile scissors jack and 80,000 units of its truck hydraulic jack. Having identified its activity cost pools and the cost drivers for each cost pool, Casey Company accumulated the following data relative to those activity cost pools and cost drivers.
LO
2Slide21
Casey Company has five activity cost pools and two products. It expects to produce 200,000 units of its automobile scissors jack and 80,000 units of its truck hydraulic jack. Having identified its activity cost pools and the cost drivers for each cost pool, Casey Company accumulated the following data relative to those activity cost pools and cost drivers.
Using
the
data provided,
Prepare a schedule showing the computations of the activity-based overhead rates per cost driver.
Prepare a schedule assigning each activity’s overhead cost to the two products.
Compute the overhead cost per unit for each product.
Comment on the comparative overhead cost per unit.
2
Apply ABC to Manufacturer
LO
2Slide22
Prepare a schedule showing the computations of the activity-based overhead rates per cost driver.
2
Apply ABC to Manufacturer
LO
2Slide23
2
Prepare a schedule assigning each activity’s overhead cost to the two products.
LO
2Slide24
c. Compute the overhead cost per unit for each product.
These data show that the total overhead assigned to 80,000 hydraulic jacks exceeds the overhead assigned to 200,000 scissors jacks. The overhead cost per hydraulic jack is $34.25. It is only $12.80 per scissors jack.
d. Comment on the comparative overhead cost per unit.
2
Apply ABC to Manufacturer
LO
2Slide25
ABC has three primary benefits:
More
cost
pools, therefore more accurate product costing.
Enhanced control over overhead costs.
Better management decisions.
LEARNINGOBJECTIVE
Explain the benefits and limitations of activity-based costing.3
LO
3Slide26
Multiple
cost
pools
Used instead
of one plantwide pool
and a single cost driver.Numerous
activity cost pools with more relevant cost drivers.
Costs allocated on basis of cost drivers used to produce each product.The Advantage of Multiple Cost Pools
LO
3Slide27
Illustration 18-13
A more detailed view of Atlas’s machining activities
The Advantage of Multiple Cost Pools
LO
3Slide28
Batch-level
Facility-level
Performed for
each unit of production
.
Example: Assembly of cell phones
Unit-level
Product-level
The Advantage of Multiple Cost Pools
CLASSIFICATION OF ACTIVITY LEVELS
LO
3Slide29
Batch-level
Facility-level
Performed every time a company produces another batch of a product.
Example: Batch of ice cream
Unit-level
Product-level
The Advantage of Multiple Cost Pools
CLASSIFICATION OF ACTIVITY LEVELS
LO
3Slide30
Batch-level
Facility-level
Performed every time a company produces a new type of product.
Example: Time spent testing a new drug by a pharmaceutical company
Unit-level
Product-level
The Advantage of Multiple Cost Pools
CLASSIFICATION OF ACTIVITY LEVELS
LO
3Slide31
Batch-level
Facility-level
Required to support or sustain an entire production process.
Example: A hospital
Unit-level
Product-level
The Advantage of Multiple Cost Pools
CLASSIFICATION OF ACTIVITY LEVELS
LO
3Slide32
Illustration 18-14
Hierarchy of activity levels
LO
3Slide33
Increase
the perceived
value
of a product or service to customers, such as:
Value-Added Activities
Manufacturing Company
Engineering design
Machining servicesAssemblyPainting
Service CompanyPerforming surgeryLegal research
Delivering packages
The Advantage of Enhanced Cost Control
LO
3Slide34
Adds
cost
to, or increases the time spent
on, a product/service without increasing its perceived value, such as:
Manufacturing Company
Storage
of inventory
Moving of inventory InspectionsFixing defective goodsSet up machines
Service CompanyTaking appointmentsReceptionBookkeeping and billingTraveling
Ordering suppliesAdvertising
Non-Value-Added Activities
The Advantage of Enhanced Cost Control
LO
3Slide35
General Mills
Management Insight
LO
3
What
Does
NASCAR Have
to Do
with Breakfast Cereal?Often the best way to improve a process is to learn
from observing a different process. Production-line technicians from food producer General Mills were
flown to North Carolina to observe
firsthand how race-car pit crews operate. In a NASCAR race, the value-added activity is driving toward the finish line; any
time spent in the pit is non–value-added. Every split second saved in the pit increases the chances of winning. From what the General Mills’ technicians learned at the car race
, as well as other efforts, they were able to reduce setup time from 5 hours to just 20 minutes.Slide36
Activity-based management (ABM)
,
a management
tool that focuses on reducing costs and improving processes and
decision-making.
Managers use ABC
via
ABMfor both strategic and operational decisions or perspectives.to help managers evaluate employees, departments, and business units.to establish performance standards, as well as benchmark against other
companies.
Advantage of Better Management Decisions
LO
3Slide37
Limitations and Knowing When to use ABC
Limitations
Expensive to
use.
Arbitrary allocations remain
.
When to Use
Product lines differ in volume and manufacturing complexity.
Product lines are numerous and diverse.
Overhead costs constitute a significant portion of total costs.
Manufacturing
process or the number of products has changed significantly.
Production or marketing managers are ignoring data.
LO
3Slide38
Engineering design
Machine setup
Toy design
Interviews of prospective
employees
Inspections after each setup
Polishing parts
Assembling partsHealth and safety
Morgan Toy Company manufactures six primary product lines in its Morganville plant. As a result of an activity analysis, the accounting department has identified eight activity cost pools. Each of the toy products is produced in large batches, with the whole plant devoted to one product at a time. Classify each of the following activities as either unit-level, batch-level, product-level, or facility-level:
3
Classify Activity Levels
Product-level
Batch-level
Product-level
Facility-level
Batch-level
Unit-level
Unit-level
Facility-level
LO
3Slide39
LEARNING
OBJECTIVE
Apply activity-based costing to service industries.
4
Overall objective:
Identify
key
activities that generate costs and keep track of how many of those activities
are completed for each service performed.General approach is to identify activities, cost pools, and cost drivers. Labeling of activities as value-added or non-value-added.
Sometimes, a larger proportion of overhead costs are company-wide costs that cannot be directly traced to specific services provided by the company.
LO
4Slide40
The public accounting firm of Check and Doublecheck prepares the following condensed annual budget.
Illustration 18-16
Condensed annual budget
of a
service
firm
under traditional
costing
Traditional Costing Example
LO
4Slide41
Assume
that Check and Doublecheck records $140,000 of actual
direct professional
labor cost during its audit of Plano Molding Company, which
was billed
an audit fee of $260,000. Under traditional costing, using 50% as the rate for applying overhead to the job, Check and Doublecheck would compute applied overhead
and operating income as shown in Illustration 18-17.
Traditional Costing Example
Illustration 18-17
LO
4Slide42
Check and Doublecheck distributes its estimated annual overhead costs of
$600,000
to
three
activity cost pools.
Activity-Based Costing Example
Illustration 18-18
Condensed annual budget
of a
service
firm
under
activity-based costing
LO
4Slide43
Assigning overhead in a service
industry.
Activity-Based Costing Example
Illustration 18-19
Assigning overhead in a
service company
LO
4Slide44
Under activity-based costing, Check and Doublecheck assigns overhead
costs of
$
57,200
as compared to $70,000
under traditional
costing.
Activity-Based Costing Example
Illustration 18-20
Comparison of
traditional costing
with ABC in a service company
LO
4Slide45
American Airlines
Service Company Insight
LO
3
Traveling Light
Have
you
flown
on American Airlines since baggage fees have been implemented? Did the fee make you so mad
that you swore that the next time you flew, you would pack fewer
clothes so you could use a carry-on bag
instead? That is exactly how American Airlines (and the other airlines that charge baggage fees) hoped that you would react. Baggage handling is extremely labor intensive. All
that tagging, sorting, loading on carts, loading in planes, unloading, and sorting again add up to about $9 per bag. Baggage handling also involves equipment costs: sorters
, carts, conveyors, tractors, and storage facilities. That’s about another $4 of equipment-related overhead per bag. Finally, there is additional fuel cost of a
40-pound item—about $2 in fuel for a 3-hour flight. These costs add up to $15 ($
9+$4+$2). Since airlines have implemented their baggage fees, fewer customers are checking bags. Not only does this save the
airlines money, it also increases the amount of space available for hauling cargo. An airline can charge at
least $
80 for hauling a small parcel for same-day delivery service.
Source: Scott McCartney, “What It Costs an Airline to Fly
Your Luggage
,” Wall Street Journal Online (November 25, 2008).Slide46
4
Apply ABC to Service Company
(a) Compute the activity-based overhead rates for each pool.
LO
4Slide47
4
Apply ABC to Service Company
(b) Determine
the overhead allocated to Job A1027 which has 150 pieces, requires
200
miles of driving, and 0.75 hours of logistics.
(
150
x
$0.70)
+
(200 x
$0.50) + (0.75 x $30) =
$227.50
LO
4Slide48
JIT manufacturing is dedicated to having the right amount of materials, parts, or products just as they are needed.
.
Illustration 18A-1
LEARNING
OBJECTIVE
5
APPENDIX
18A
: Explain just-in-time (JIT) processing.
LO
5Slide49
Objective of JIT Processing
To eliminate all manufacturing inventories.
Elements of JIT Processing
Dependable suppliers.
Multiskilled work force.
Total quality control system.
LO
5
Just-In-Time Inventory ProcessingSlide50
Benefits of JIT Processing
Significant reduction or elimination of manufacturing inventories.
Enhanced product quality.
Reduction or elimination of rework costs and inventory storage costs.
Production cost savings from the improved flow of goods through the processes.
LO
5
Just-In-Time Inventory ProcessingSlide51
Copyright ©
2015
John Wiley & Sons, Inc. All rights reserved. Reproduction or translation of this work beyond that permitted in Section 117 of the 1976 United States Copyright Act without the express written permission of the copyright owner is unlawful. Request for further information should be addressed to the Permissions Department, John Wiley & Sons, Inc. The purchaser may make back-up copies for his/her own use only and not for distribution or resale. The Publisher assumes no responsibility for errors, omissions, or damages, caused by the use of these programs or from the use of the information contained herein.
Copyright