

Missy Petty Forecast Impact and Quality Assessment Section NOAAESRLGSD RITT Forum 7172013 FIQAS Forecast Impact and Quality Assessment Section Mission Advance the understanding and use of weather information through impactbased assessments and targeted information delivery to benefit d ID: 236357
Download Presentation The PPT/PDF document "Event-based Verification and Evaluation ..." is the property of its rightful owner. Permission is granted to download and print the materials on this web site for personal, non-commercial use only, and to display it on your personal computer provided you do not modify the materials and that you retain all copyright notices contained in the materials. By downloading content from our website, you accept the terms of this agreement.


Slide1
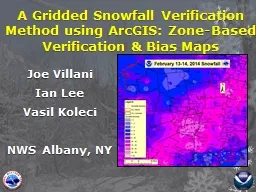
Event-based Verification and Evaluation of NWS Gridded Products: The EVENT Tool
Missy Petty
Forecast Impact and Quality Assessment Section
NOAA/ESRL/GSD
RITT Forum
7/17/2013Slide2
FIQAS
Forecast Impact and Quality Assessment Section
Mission: Advance the understanding and use of weather information through impact-based assessments and targeted information delivery to benefit decision making in response to high-impact weather events
Primary activitiesIndependent assessments of quality and skill of aviation weather forecast products in or transitioning to NWS or FAA operationsDevelopment of technologies to present and/or disseminate quality and skill information for analysis and decision support
Forecast Impact and Quality Assessment Section
2Slide3
EVENT Background
Tool development sponsored by NWS
Supports NWS efforts to measure forecast accuracy relative to aviation traffic flow management decisions
Skill information is framed by requirements established by the Traffic Flow Management Weather Requirements Working Group (TRWG) Forecast Impact and Quality Assessment Section
3Slide4
TRWG Requirements
Forecast Impact and Quality Assessment Section
4Slide5
EVENT Techniques
Event-based techniques developed as part of an assessment of NDFD as compared to other operational forecasts
Evaluation of forecast performance in prediction of thunderstorms
Terminal and en-route contextsTerminal: Do forecasts accurately predict significant thunderstorms within a 75 nmi radius of the terminal?En-route
: Do forecasts accurately predict significant high-altitude thunderstorm activity that affects en-route flow along jetways in the northeast?
Determine by lead time the temporal and spatial displacement error for event onset and cessation
Forecast Impact and Quality Assessment Section
5Slide6
EVENT-based Techniques: Challenges
Comparison of different forecasts (‘apples-to-apples’)
Definition of an event
Determining a forecast-observation event matchComputing appropriate skill scoresForecast Impact and Quality Assessment Section
6Slide7
Forecasts
Forecast Impact and Quality Assessment Section
7
Product
Fields/Thresholds
NDFD (5km)
Treated probabilistically,
using Trace and Likely thresholds
RAP (hourly,
13.5km)
Convective
Precip
>= 1mm
LAMP (hourly,
2.5km)
Thunderstorm probabilitySlide8
Observations
Definition of a
thunderstorm
Moist convection + lightningThunderstorm observation produced byCombining CIWS VIL (15 min, 1km) with National Lightning Data Network (NLDN) data
*Note:
T
otal lightning used to
determine the CIWS VIL and
NLDN
strike characteristics needed to identify the presence of a thunderstorm
8Slide9
Instantaneous Events: Terminal
The domain of interest is 75-nmi radius around each of the core-30 airports
Approach
applies to both forecasts and observationsThe coverage of the forecast within terminal domain is computedCoverage weighted by probability for probabilistic forecastsIf coverage exceeds 10%, an instantaneous thunderstorm event is identified
9
75 nmiSlide10
Instantaneous Events: Jetway
(En-route context)
High-traffic
jetways intersecting/bounded by NE Flow Constrained Area boundaries (AFP 05 and 08)Three Jetway Regions All, East-West, North-South
Combination of jet routesJetway is buffered by 20nmi and partitioned into 40nmi segmentsIf segment along a
jetway
is blocked with a Flow Constraint Index (FCI)
>
0.5, then the
jetway
is blocked
An instantaneous event occurs if 10% of all
jetways
within a region are blocked
10Slide11
Merging Events
Instantaneous events are merged, for both forecasts and observations, into events with duration
Merging occurs per forecast lead
‘NDFD Centric’ merging criteria was applied: Instantaneous events are merged into a larger event if time between events is less than 3 hoursIf NDFD is excluded, 1 hour merging criteria is applicableForecast Impact and Quality Assessment Section
11Slide12
Matching of Merged Events
Onset and cessation are treated separately
Matches are computed per forecast
leadTemporal criteria for a match is applied using a 3 hour windowPairings are optimized according to the Gale-Shapley (1962) procedure
12
Obs
Forecast
Hit
Hit
Hit
Hit
Miss
Miss
False
Alarm
False
Alarm
Miss
Miss
Hit
Hit
Hit
HitSlide13
Displacement can be calculated only for matched onsets and cessations
D
Tonset = Fonset – Oonset
D
T
cessation
=
F
cessation
–
O
cessation
Temporal Displacement
13
Obs
Forecast
D
T
onset
F
onset
O
onsetSlide14
Spatial Displacement
For all matched onset and cessation pairs
Center of mass is weighted by forecast probability
The average of the minimum distances between all forecast objects and observation objects yields the spatial displacement
14
Y
75 nmi
Forecast
CIWS
observation
X
= Center
of mass (CM)
Distance between CMs
X
X
X
X
X
Slide15
Metrics
For onset and cessation, the following statistics are computed:
POD—(Probability of Detection) Percentage of all observed events that are correctly forecast
FAR—(False Alarm Ratio) Percentage of all forecasts that are incorrectCR— (Correspondence Ratio= ratio of intersection to union) A measure of agreement of forecasts and observations Displacement
SpatialTemporal
Forecast Impact and Quality Assessment Section
15Slide16
EVENT Architecture
Forecast Impact and Quality Assessment Section
16
Internet
FIQAS Data Servers
FIQAS Web-servers
Data Storage
-
MYSQL Database
User
Interface
-
Apache
Django
Python
Data Storage
-
MYSQL Database
FIREWALL
Data Acquisition
And
Processing
-
Python
Java
ReplicationSlide17
EVENT Demo
Forecast Impact and Quality Assessment Section
17Slide18
Future Work
Incorporate HRRR into tool
Incorporate MRMS as a replacement for CIWS
Enhance en-route techniques (FCI)Develop ‘Event viewer’ to view accuracy for specific eventsForecast Impact and Quality Assessment Section
18Slide19
Questions?
Forecast Impact and Quality Assessment Section
19Slide20
More Information
Contact: Missy Petty,
melissa.a.petty@noaa.gov
EVENT URL: http://esrl.noaa.gov/fiqas/tech/event/Forecast Impact and Quality Assessment Section
20