
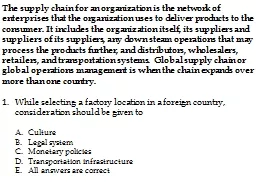
Lecture 21 Transportation Networks The Bis Corporation Paint manufacturer Established in 1964 8 manufacturing plants 17 warehouses 2000 retail stores 4000 SKUs Owned by 12 shareholders and run by a new CEO ID: 781150
Download The PPT/PDF document "IE 8580 Module 2: Transportation in the..." is the property of its rightful owner. Permission is granted to download and print the materials on this web site for personal, non-commercial use only, and to display it on your personal computer provided you do not modify the materials and that you retain all copyright notices contained in the materials. By downloading content from our website, you accept the terms of this agreement.


Slide1
IE 8580 Module 2:Transportation in the Supply Chain
Lecture
2.1:
Transportation Networks
Slide2The Bis Corporation
Paint manufacturer
Established in 1964
8 manufacturing plants17 warehouses2,000 retail stores4,000 SKUsOwned by 12 shareholders and run by a new CEO
IE 8580, mason@clemson.edu
2
Slide3Problem
Although a high profit margin business (gross margin of 20%), idea is that the distribution system could be improved
Designed 15 years ago
Produce and store at manufacturing plantsPick, load, and ship to warehouseUnload and store at the warehousePick, load, and deliver to storesNeed to
re-engineer their distribution and supply chain network
IE 8580, mason@clemson.edu
3
Slide4Design Requirements
What is the best network configuration?
1-tier network not efficient
Given the network, where should the inventory be held?4,000 SKUs – not obvious how to position inventoryWhich plant should produce which product?IE 8580, mason@clemson.edu
4
Slide5Data
Aggregate demand
Grouped customers into 550 zones and products into 5 families
Collect dataDemand by SKU per product family for each zoneAnnual production capacity by SKU’s at each facility Max capacity by SKU at each warehouseTransportation costs per product family per mile between all production facilities and warehousesSetup cost to establish a new warehousePotential locations for new warehouses
IE 8580, mason@clemson.edu
5
Slide6Other Relevant Information
CEO requires delivery time from warehouse to customer < 24 hours
Implies distance between warehouse and customer zone <450 miles
Growth industry with 7%, 3%, 6%, 5%, and 6% annual growth rate projected for families 1 through 5, respectivelyQuestionsShould Bis keep current strategy or switch to 2-tier?Is the model good enough to trust the results?What is the optimal inventory positioning?
Should production of SKUs be consolidated?
IE 8580, mason@clemson.edu
6
Slide7What is Network Planning?
Way
a firm structures and manages the physical supply chain – suppliers, plants, warehouses, distribution centers,
cross-docking facilitiesTypically, there are three stepsNetwork design: number, location, size of plants, warehouses, DC’s
Inventory positioning: where to keep stock, how muchResource allocation: capacity allocation, outsourcing, offshoring
IE 8580, mason@clemson.edu
7
Slide8General Network Design
Mathematical models are used to identify
Supply points: suppliers and plants
Distribution: warehouses, DC’s, cross-dockingConnecting pathwaysAssumptions are used to make the problem more tractableBecoming less critical with better computing and approximation algorithms
IE 8580, mason@clemson.edu
8
Slide9Focus on Warehouses
Admittedly this is a very simple example but it lets us
work
all the way through a scenarioAdapting this “strategy” to your environment will require some thinking and creativity … and maybe working with a university!
Assume supplier and customer locations are fixedDetermine
Number of warehouses
Location of warehouses
Size of warehouses
Space allocation for warehouses
Assignment of products to warehouses to customers
IE 8580, mason@clemson.edu
9
Slide10Increasing the Number of Warehouses …
Improves service level
Increases inventory cost
Increases overhead and start-up costsReduces outbound transportation costsIncreases inbound transportation costsWhat is the right thing to do?IE 8580, mason@clemson.edu
10
Slide11We Need Data—Some is Easy to Get/Accurate, Some Is Not
Locations
customers, warehouses, DC’s, production facilities and suppliers
Product information Volumes and special transport considerationsDemandsExisting and forecastedTransportation costsWarehouse costsLabor, inventory holding, material handling, etc.
Delivery restrictionsShipment sizes and frequency of deliveriesCustomer service requirements
IE 8580, mason@clemson.edu
11
Slide12If your problem is big, effective data aggregation is critical
Customers can often be aggregated according to location
According
to 3 or 5 digit ZIP codeProducts can be aggregate according to similaritiesDistribution patterns or product typesThis sword has two edgesAdvantages:
smoothes variability, produces a tractable problemDisadvantage: easy to over-do
and get meaningless answers
IE 8580, mason@clemson.edu
12
Slide13Ground transportation rates in the US are available
Internal fleet – (cost/mile) x miles
External fleet
TLeach state is a zone (except FL, CA, TX)cost per mile established from each zone to all other zones
LTLrates based on class of cargo
ZIP code
to
ZIP code
There are ways to estimate
mileage
Straight line for short distances; long distance correction for earth’s curvature
“Fudge factor” because roads are not straight
Google Earth/Maps API calls
IE 8580, mason@clemson.edu
13
Slide14Warehouse costs are higher than most folks think
Handling costs
Labor
and utilityTypically proportional to annual flow through
warehouse
Fixed costs
Equipment
and rent, for example
Not
related to volume
Storage costs
Inventory
holding costs typically computed as proportional to the average inventory level
Finding
the average inventory level for a particular customer is sometimes difficult – one solution is the inventory turnover ratio
IE 8580, mason@clemson.edu
14
Slide15Other warehouse related items
Capacity
Inventory
turnover ratio can help to estimatePotential locationsGeographical and infrastructure locationsNatural resources and laborTaxes and incentives
Service level requirementsMinimum distance or maximum time
Future demand considerations
IE 8580, mason@clemson.edu
15
Slide16Model building and validation
Use most appropriate tool
OR model, simulation
Solve for plant conditions and verify output is reasonable approximation of realityBe careful of extrapolationUse this as a starting point for decision making
IE 8580, mason@clemson.edu
16
Slide17Example (Page 92, Simchi Levi et al.)
Single product, two plants, two warehouses, 3 customers
Plant capacities: 140,000 and 60,000
Customer demands: 50,000, 100,000, and 50,000Unit distribution costs ($)
P1
P2
C1
C2
C3
W1
0
4
3
4
5
W2
5
2
2
1
2
IE 8580, mason@clemson.edu
17
Slide18The Basic Problem
Plant 1
W/H 1
Customer 1
0
5
4
2
3
4
5
2
1
2
Plant 2
W/H 2
Customer 2
Customer 3
140
60
50
100
50
IE 8580, mason@clemson.edu
18
Slide19Surely you can do this one in your head, right?Who needs math, anyways?!?!?
IE 8580, mason@clemson.edu
19
Slide20Approach #1
Since shipping from W/H 2 is cheaper than W/H 1
for both customers, use
only W/H 2.
Plant 1
W/H
1
Customer 1
0
5
4
2
3
4
5
2
1
2
Plant 2
W/H 2
Customer 2
Customer 3
140
60
50
100
50
140
60
50
100
50
IE 8580, mason@clemson.edu
20
Slide21Approach #2
Select the path with the minimum cost starting with Customer 1 and proceed sequentially.
Plant 1
W/H
1
Customer 1
0
5
4
2
3
4
5
2
1
2
Plant 2
W/H 2
Customer 2
Customer 3
140
60
50
100
50
50
6
0
90
IE 8580, mason@clemson.edu
21
Slide22Resulting Costs
Heuristic 1
140K units*$5/unit+60K*$2+50K*$2+100K*$1+50K*$2 = $1,120,000
Heuristic 2
50K units*$0/unit+90K*$5+60K*$2+50K*$3+100K*$1+50K*$2 = $920,000
IE 8580, mason@clemson.edu
22
Slide23Are you going to use and bet your career on:
1. opinions based on experience and gut feel
or
2. hardcore, mathematical analysis
So How Well Do You Trust Yourself?
IE 8580, mason@clemson.edu
23
Slide24Comparisons
Heuristic 1: $1,120,000
Heuristic 2: $ 920,000
Optimal: $740,000
You just overpaid by:
51%
if you used Heuristic 1
25%
if you used Heuristic 2
IE 8580, mason@clemson.edu
24
Slide25Simulation and OptimizationOptimization
Models are typically inferior because assumptions have to be made for tractability
Solutions are determined; that is, you don’t have to guess them – you just develop the model
Solutions can be great starting points for system designSimulationModels can be quite accurate with many of the stochastic elements capturedIt only shows system performance based on the controls that you guessCan be of great value when you have a really good starting point and want to “tune” things or play “what if”
IE 8580, mason@clemson.edu
25
Slide26Scope of Network ConfigurationIn practice, there are both greenfield and brownfield requirements
Greenfield
Complete new design because you are just starting or because the existing structure has been modified so much that a fresh approach is required
BrownfieldMust modify within the existing structure or include new features like adding warehouse-to-warehouse flow or customer specific service level requirementsYour authors call the ability to accommodate this range “flexibility” and it is critical to network configuration design
IE 8580, mason@clemson.edu
26