
Dr Hussein Ahmed Hassan Contents CT Hardware An Update Dual Energy CT CT Perfusion Imaging Dual Energy CT INTRODUCTION Conventional CT scanners operating at a single energy provide morphologic imaging only with little materialspecific information in body imaging ID: 915071
Download Presentation The PPT/PDF document "Advances in Computed Tomography" is the property of its rightful owner. Permission is granted to download and print the materials on this web site for personal, non-commercial use only, and to display it on your personal computer provided you do not modify the materials and that you retain all copyright notices contained in the materials. By downloading content from our website, you accept the terms of this agreement.


Slide1
Advances in Computed Tomography
Dr. Hussein Ahmed Hassan
Slide2Contents
CT Hardware: An Update
,
Dual Energy CT
CT Perfusion Imaging
Slide3Dual Energy CT
Slide4INTRODUCTION
Conventional CT scanners, operating at a single energy, provide morphologic imaging only, with little material-specific information in body imaging.
Dual energy CT utilizes the principle that different materials show different attenuation at varying energy levels, and this difference in attenuation can be used for tissue characterization.
Slide5Dual energy CT
scans
are
a
relatively new form
of
CT
scanning
that use
separate
X-ray
energies to make images. Images can be generated:
by the
simultaneous
use
of
two
X-ray
tubes (‘dual
source
’
)
;
by using an
X-ray
detector with
separate layers
to detect two different
energy ranges
(‘dual layer’);
or
by using
a single scanner
to
scan
twice using
two different
energy levels (electronic
kVp
switching
)
Slide6A to C Dual energy scanners
the first generation DS-DECT
scanners (A), the second
generation DS-DECT scanner
(B) and SS-DECT scanner (C).
In a first generation DS-DECT
scanner, two tubes are placed
in the gantry at an angle of 90°
to each other. Tube A has
a higher
kVp
(140) and had a larger detector array of FOV 50 cm. The smaller detector array (26 cm FOV)
is paired against the lower energy tube (80 KV). In a second generation DS-DECT scanner, the smaller detector (FOV 33 cm) is paired with a higher energy tube with
a selective photon shield. The SS-DECT scanner has a single tube and a detector array with 50 cm FOV. There is rapid switching of kVp in the tube
Slide7Advantages
CT
angiography.
Dual energy
scans
can amplify the iodine
signal of
contrast agents, improving the delineation
of
arteries.
They
can also
better
distinguish iodine from
calcium, therefore allowing better
bone subtraction around vessels; for example, at the skull
base.
CT of the kidney, ureter and bladder (CT KUB). Dual energy CT KUB scans
can reliably distinguish urate from non-urate
calculi.CT imaging around metal implants. Dual energy CT can significantly reduce the streak artefact normally associated with metal implants and allow
better visualisation; for example, around spinal rods
or hip replacements.
Slide8With
fast
kV-switching, Dual Energy data can be acquired by rapidly
switching
the
tube
voltage between CT projections.
Disadvantages
lower
number
of
projections are available to create each image; reduced image
quality
In addition,
only
the kVp can be modulated
between
individual projections.
Resulting
over-
exposure in the highkV projections
or
under-exposure in the low-kV
projections
Slide9Idealized dual
layer
detector technology:
In reality a
certain
amount of
high and low-energy photons are
registered
in both
layers
which
significantly
reduces spectral separation
DisadvantagesDetector
not able to distinguish between high and low energy photons. Both high and low energy photons
are absorbed in both layers
The construction of this detector requires two photodiodes, which significantly increases electronic noise. Leads to inferior image
quality for dual and single energy images.
Slide10Slow
kV-switching: Both
kV
and
mA
are
switched
between half rotations
of
the
gantry,
either in
sequence or in spiral
modesDisadvantages
The time needed to
switch from 80 kV to 140 kV and adjust the mA is typically in the order of 100
ms.During
this time, the patient is exposed to radiation that does not provide useful
information.Thus,
this method does not follow the ALARA
(“as low as reasonably achievable”) principle.
Slide11Dual
Energy
imaging means that the
system
uses
two
X-ray
sources simultaneously
at different energy
levels.
This
makes it possible to
differentiate
between fat, soft
tissue,
and
bone,
and
also
between
calcifications
and contrast material
(iodine) on
the basis
of
their unique
energy-dependent
attenuation
profiles.
Slide12Image Display in DECT
Images generated in DECT can have two types of display:
Material density display
In DECT, the material density display can be iodine density display or water density display.
Monoenergetic
image display .The
monoenergetic
or
pseudomonochromatic
display are energy-specific display. Images are processed at any given
kVp
from the dual energy data sets, which resemble images physically acquired after scanning at that given kVp.
Slide13A and B Material density display. Iodine overlay map (A), created by overlapping the iodine density images over
monoenergetic
image, highlight the organs containing iodine (colored red). The gradient of color varies according to the degree of enhancement of the organ. The water density display (B) is equivalent to virtual unenhanced image. Note that both calcium and iodine appear dense on a routine single energy CT, but they can be differentiated on iodine map images as calcium will not be highlighted on a iodine map image (for example, the calculus in this image)
Slide14A and B Simple hepatic cysts, imaging performed on a second generation DS-DECT scanner. Simulated
monoenergetic
image display at 70 kV generated from a dual energy dataset (A) shows
hypodense
focal lesions in segment III and V. Iodine overlay maps (B) show them to be dark (not taking up iodine)
Slide15Virtual
monoenergetic
images generated from a DS-DECT scanner. It is evident from the images that the attenuation of iodine and the image contrast are high at lower energy images, although the images appear more noisy. As the
kVp
increases, the contrast difference between various tissues becomes negligible and the 160 kV image becomes identical to a
noncontrast
image
Slide16A and B Renal calculi characterization by DECT. Images acquired at 100 and 140 kV in a DS-DECT scanner. A reference dual energy ratio of 1.13 is taken to differentiate uric acid from
nonuric
acid calculi. The uric acid calculus (A) shows a dual energy ratio less than 1.13 and are colored red (arrow). The
nonuric
acid calculi show a dual energy ratio above the reference line and are colored blue (B)
Slide17A to E Focal hepatic
steatosis
. The area of focal fat deposition is seen as a
hypodensity
in segment 4b adjacent to the
falciform
ligament (arrow in A).
Monoenergetic
display (B) derived from a DS-DECT scanner (
Somatom
Definition Flash, Siemens) with tin filtration shows the increase in attenuation in higher kV images ( attenuation of 23.8 at 70 kV, shown with a yellow line and 34.2 at 140 kV, shown with a red line) (C), which is suggestive of fatty change. In comparison, normal enhancing liver parenchyma shows a decrease in attenuation (D, E) in the higher energy images (attenuation of 82.1 at 70 kV and 64.1 at 140 kV images)
Slide18CT Perfusion Imaging
Slide19Perfusion computed tomography
Perfusion computed tomography (CT) allows functional evaluation of tissue
vascularity
.
It measures the temporal changes in tissue density after intravenous injection of a contrast medium (CM) bolus using a series of dynamically acquired CT images
Slide20Slide21Technique of CT Perfusion
Step I involves acquisition of unenhanced CT images to cover the entire region of interest.
Step II involves selection of the slice for dynamic imaging. The selected slices should be chosen to cover the maximum tumor area. The total tumor coverage area is 2 cm for 16MDCT and 4 cm for 64MDCT and up to 9 cm for 128 MDCT scanner.
Step III involves contrast enhanced dynamic image acquisition.
Step IV involves post-processing of CT data to generate colored perfusion maps of blood flow (BF), blood volume (BV), mean transit time (MTT) and permeability surface area product. Time attenuation curves showing the enhancement characteristics of the artery and tumor during the first pass and delayed phase of perfusion CT acquisition can be obtained.
Slide22A to D Normal cerebral perfusion CT maps representing CBF (A), CBV (B), MTT (C), and TTP (D) respectively
Slide23Slide24A and B Perfusion CT maps representing CBV (A) and MTT (B) in a patient showing a central infarct core (CBV = 1.2
mL
/100
mL
) in the region of the left basal ganglia with a large surrounding ischemic penumbra (
rMTT
= 210%) revealing CBVMTT mismatch (relatively preserved CBV with increase in MTT values)—case of acute ischemic stroke
Slide25A and B
Noncontrast
axial CT images reveal large areas of subtle loss of
graywhite
matter differentiation in the left
frontoparietal
region—case of large hemispheric infarct
Slide26Perfusion maps (same case as in
Noncontrast
axial CT images ) show extensive area of perfusion defects involving the left cerebral hemisphere with a central infarct core revealing severely reduced CBV and CBF values and surrounding areas of ischemic penumbra demonstrating relatively preserved CBV, moderate reduction in CBF and prolongation of MTT, TTP values
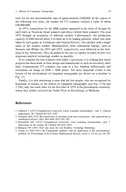
Slide27Slide28Slide29CONCLUSION
Computed tomography hardware thus is a rapidly evolving field, constantly introducing newer technologies for the user as the vendors continue to innovate.
Slide30Thank you