
Q2 2021 USD Change Net Revenues GAAP Net Income GAAP Earnings Per Share NonGAAP Net Income1NonGAAP Earnings Per Share11 investment gains and losses amortization ing acquisitionrelated costs and ID: 872935
Download Pdf The PPT/PDF document "In billions except percentages and per s..." is the property of its rightful owner. Permission is granted to download and print the materials on this web site for personal, non-commercial use only, and to display it on your personal computer provided you do not modify the materials and that you retain all copyright notices contained in the materials. By downloading content from our website, you accept the terms of this agreement.


1 In billions, except percentages and per
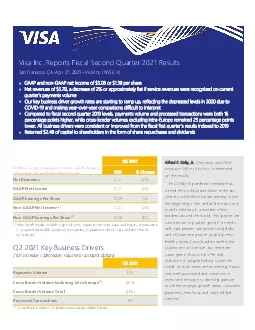
In billions, except percentages and per share data. % change is calculated over the comparable prior-year period. Q2 2021 USD % Change Net Revenues GAAP Net Income GAAP Earnings Per Share Non-GAAP Net Income(1) Non-GAAP Earnings Per Share(1) (1) investment gains and losses, amortization ing acquisition-related costs and the related Q2 2021 Payments Volume 11% Cross-Border Volume Excluding Intra-Europe(1)(21%) Cross-Border Volume Total (11%) 8% (1)Cross-border volume excluding transactions within Europe. Visa Inc. Reports Fiscal Second Quarter 2021 Results San Francisco, CA, April 27, 2021 Visa Inc. (NYSE: V) GAAP and non-GAAP net income of $3.0B or $1.38 per share Net revenues of $5.7B, a decrease of 2% quarters payments volume Our key business driver growth rates are starting to ramp up, reflecting the depressed levels in 2020 due to COVID-19 and making year-over-year comparisons difficult to interpret Compared to fiscal second quarter 2019 levels, paymen percentage points higher, while cross-border volumes excluding intra-Europe remained 25 percentage points lower. All business drivers were consistent or improved from the fiscal first quarters results indexed to 2019 Returned $2.4B of capital to shareholders in the form of share repurchases and dividends Alfred F. Kelly, Jr.Chairman andChief Executive Officer, Visa Inc., commented Fiscal Second Quarter 2021 Financial Highlights GAAP net income in the fiscal second quarter was $3.0 billion or $1.38 per share, a decrease of 2% and flat, respectively, over prior years results. Current years results included $152 million pertaining to a special item for additional indirect taxes related to prior periods, $156 million of net gains from equity investments and $18 million regarding the amortization of acquired intangible assets and non-recurring acquisition-related costs. Prior years results included $2 million of net losses from equity investments and $16 million corresponding to the amortization of acquired intangible assets and non-recurring acquisition-related costs. Excluding these items and the related tax impacts, non-GAAP net income for the quarter was $3.0 billion or $1.38 per share, decreases of and 1%, respectively, over prior years results (refer to the accompanying financial tables for further details and a reconciliation of the non-GAAP measures presented). Non-GAAP earnings per share was approximately flat on a constant-dollar basis. All references to earnings per share assume fully-diluted class A share count. Net revenues in the fiscal second quarter were $5.7 billion, a decrease of 2%, primarily driven by the year-over-year decline icross-border volume, mostly offset by growth in payments volume
2 and processed transactions. Net revenues
and processed transactions. Net revenues decreased approximately 3% on a constant-dollar basis. Had we recognized service revenues on current quarter payments volume and other revenue components remained unchanged, net revenues would have been approximately flat. Payments volume for the three months ended December 31, 2020, on which fiscal second quarter service revenue is recognized, increased 5% over the prior year on a constant-dollar basis. Payments volume for the three months ended March 31, 2021, increased 11% over the prior year on a constant-dollar basis. Cross-border volume excluding transactions within Europe, which drive our international transaction revenues, declined 21% on aconstant-dollar basis for the three months ended March 31, 2021. Total cross-border volume on a constant-dollar basis declined 11% in the quarter. Total processed transactions, which represent transactions processed by Visa, for the three months ended March 31, 2021, were 37.6 billion, an 8% increase over the prior year, led by domestic transactions. Fiscal second quarter service revenues were $2.8 billion, an increase of 8% over the prior year, and are recognized based on payments volume in the prior quarter. All other revenue categories are recognized based on current quarter activity. Data processing revenues grew 11% over the prior year to $3.0 billion. International transaction revenues declined 19% over the prioyear to $1.5 billion. Other revenues of $392 million were flat over the prior year. Client incentives, a contra-revenue item, wbillion and represented 25.8% of gross revenues. GAAP operating expenses were $2.1 billion for the fiscal second quarter, an 11% increase over the prior year's results, including the special item related to the additional indirect taxes in the current year and the amortization of acquired intangible assets anrecurring acquisition-related costs in the current and prior year. Excluding these operating expense items, non-GAAP operating expenses increased 3% over the prior year, primarily driven by an increase in personnel expenses partially offset by decreases general and administrative, marketing and professional fees. GAAP non-operating income was $47 million for the fiscal second quarter, including $156 million of net equity investment gains.Excluding this item, non-GAAP non-operating expense was $109 million. GAAP effective income tax rate was 16.6% for the quarter ended March 31, 2021, including the tax impacts of the special item, nequity investment gains, amortization of and non-recurring acquisition-related costs. Excluding thesitems, the non-GAAP effective income tax rate was 16.8% for the quarter ended March 31, 2021. GAAP and non-GAAP tax rates benefited from completing cer
3 tain tax audits. Cash, cash equivalents
tain tax audits. Cash, cash equivalents and investment securities were $18.7 billion at March 31, 2021. The weighted-average number of diluted shares of class A common stock outstanding was 2.19 billion for the quarter ended March 31, 2021. During the three months ended March 31, 2021, Visa repurchased 8.3 million shares of class A common stock at an average price of $208.51 per share for $1.7 billion. In the six months ended March 31, 2021, Visa repurchased a total of 17.0 million shares of class A common stock, at an average price of $205.33 per share, using $3.5 billion of cash on hand. The Company had $9.9 billion of remaining authorized funds for share repurchase as of March 31, 2021. On April 23, 2021, the board of directors declared a quarterly cash dividend of $0.32 per share of class A common stock (determined in the case of class B and C common stock and series A, B and C convertible participating preferred stock on an as-converted basis) payable on June 1, 2021, to all holders of record as of May 14, 2021. Financial Outlook for Fiscal Full-Year 2021 Given the continuing impact of COVID-19 and the significant uncertainty in the global economy, it is difficult to reasonably estimate the Company's annual results; therefore we are not providing a fiscal full-year 2021 outlook at this time. Fiscal Second Quarter 2021 Earnings Results Call Details Visas executive management team will host a live audio webcast beginning at 5:00 p.m. Eastern Time (2:00 p.m. Pacific to discuss the financial results and business highlights. All interested parties are invited to listen to the live webcast at http://investor.visa.com. A replay of the webcast will be available on the Visa Investor Relations website for 30 days. Investo information, including supplemental financial information, is available on Visa Inc.s Investor Relations website at http://investor.visa.com. This press release contains forward-looking statements within the meaning of the U.S. Private Securities Litigation Reform Act 1995 that relate to, among other things, the impact on our underlying business drivers and other volume and transaction trends a result of COVID-19, our future operations, prospects, developments, strategies and business growth. Forward-looking statementgenerally are identified by words such as anticipates, estimates, expects, intends, may, projects, outlook, could, should, will, continue and other similar expressions. All statements other than statements of historical fact could be forward-looking statements, which speak only as of the date they are made, are not guarantees of future performance and are subject to certain risks, uncertainties and other factors, many of which are beyond our contro
4 l and are difficult to predict. Actual r
l and are difficult to predict. Actual results could differ materially from those expressed in, or implied by, our forward-looking statements due to a variety factors, including, but not limited to: impact of global economic, political, market, health and social events or conditions, including the impact of COVID-19; increased oversight and regulation of the global payments industry and our business; impact of government-imposed obligations and/or restrictions on international payment systems; outcome of tax, litigation and governmental investigation matters; increasingly intense competition in the payments industry, including competition for our clients and merchants; proliferation and continuous evolution of new technologies and business models; our ability to maintain relationships with our clients, acquirers, processors, merchants and other third parties; brand or reputational damage; exposure to loss or illiquidity due to settlement guarantees; the impact of the United Kingdoms withdrawal from the European Union; a disruption, failure, breach or cyber-attack of our networks or systems; risks, uncertainties and the failure to achieve the anticipated benefits with respect to our acquisitions and other strategic investments; and other factors described in our filings with the U.S. Securities and Exchange Commission, including our Annual Report on Form 10-K for the year ended September 30, 2020, and our subsequent reports on Forms 10-Q and 8-K. Except as required by law, we do not intend to update or revise any forward-looking statements as future events or otherwise. Visa Inc. (NYSE: V) is the worlds leader in digital payments. Our mission is to connect the world through the most innovative,reliable and secure payment network enabling individuals, businesses and economies to thrive. Our advanced global processing network, VisaNet, provides secure and reliable payments around the world, and is capable of handling more than 65,000 transaction messages a second. Our relentless focus on innovation is a catalyst for the rapid growth of digital commerce on anydevice for everyone, everywhere. As the world moves from analog to digital, Visa is applying our brand, products, people, netwoand scale to reshape the future of commerce. For more information, visit usa.visa.com/about-visa.html, usa.visa.com/visa-everywhere/blog.html and @VisaNews. Contacts Investor Relations Mike Milotich or Jennifer Como, 650-432-7644 InvestorRelations@visa.com Media Relations Andy Gerlt, 650-432-2990 Press@visa.com Fiscal Second Quarter 2021 Financial Summary YoY ChangeGAAPNon-GAAPGAAPNon-GAAPRevenuesService revenues2,845$ 2,845$ 8%8%Data processing revenues2,9962,99611%11%International trans
5 action revenues1,4881,488(19%)(19%)Other(19%)Other")
action revenues1,4881,488(19%)(19%)Other revenues3923920%0%Client incentives(1,992)(1,992)17%17%Net revenues5,7295,729(2%)(2%)Operating ExpensesPersonnel1,1141,11218%19%Marketing206206(12%)(12%)Network and processing179179(2%)(1%)Professional fees8280(21%)(21%)Depreciation and amortization2011875%4%General and administrative36321135%(22%)Litigation provision33(66%)(66%)Total operating expenses2,1481,97811%3%Operating income3,5813,751(9%)(5%)Non-operating income/(expense)47(109)(150%)15%Effective tax rate16.6%16.8%(3 ppt)(3 ppt)Net income3,026$ 3,031$ (2%)(2%)Earnings per share1.38$ 1.38$ 0%(1%)YoY Change ConstantNominalPayments volume11%14%Cross-border volume excluding intra-Europe(1)(21%)(19%)Cross-border volume total(11%)(6%)Processed transactions8%8%(1) Cross-border volume excludin g transactions within Euro p Q2 FISCAL 2021 INCOME STATEMENT SUMMARY(in millions, except percentages and per share Three Months Ended March 31, 2021Q2 FISCAL 2021 KEY BUSINESS DRIVERS 6 Visa Inc. Consolidated Balance Sheets (unaudited) March 31, 2021 September 30, 2020 (in millions, except p e r share data) Assets Cash and cash equivalents $ 16,494 $ 16,289 Restricted cash equivalents — U.S. litigation escrow 894 901 Investment securities 2,058 3,752 Settlement receivable 1,434 1,264 Accounts receivable 1,791 1,618 Customer collateral 2,057 1,850 Current portion of client incentives 1,324 1,214 Prepaid expenses and other current assets 849 757 Total cu rrent assets 26,901 27,645 Investment securities 110 231 Client incentives 3,252 3,175 Property, equipment and technology, net 2,684 2,737 Goodwill 15,980 15,910 Intangible assets, net 27,823 27,808 Other assets 3,445 3,413 Total assets $ 80,195 $ 80,919 Liabilities Accounts payable $ 126 $ 174 Settlement payable 2,000 1,736 Customer collateral 2,057 1,850 Accrued compensation and benefits 794 821 Client incentives 4,760 4,176 Accrued liabilities 2,088 1,840 Current maturities of debt — 2,999 Accrued litigation 886 914 Total cu rrent liabilities 12,711 14,510 Long - term debt 20,974 21,071 Deferred tax liabilities 5,212 5,237 Other liabilities 3,602 3,891 Total li abilities 42,499 44,709 Equity Preferred stock
6 , $0.0001 par value, 25 shares authorize
, $0.0001 par value, 25 shares authorized and 5 shares issued and outstanding as follows: Series A convertible participating preferred stock, less than one shares issued and outstanding at March 31, 2021 and September 30, 2020 (the “series A preferred stock”) 713 2,437 Series B convertible participating preferred stock, 2 shares issued and outstanding at March 31, 2021 and September 30, 2020 (the “UK&I preferred stock”) 1,097 1,106 Series C convertible participating preferred stock, 3 shares issued and outstanding at March 31, 2021 and September 30, 2020 (the “Europe preferred stock”) 1,537 1,543 Class A common stock, $0.0001 par value, 2,001,622 shares authorized, 1,694 and 1,683 shares issued and outstanding at March 31, 2021 and September 30, 2020, respectively — — Class B common stock, $0.0001 par value, 622 shares authorized, 245 shares issued and outstanding at March 31, 2021 and September 30, 2020 — — Class C common stock, $0.0001 par value, 1,097 shares authorized, 11 shares issued and outstanding at March 31, 2021 and September 30, 2020 — — Right to recover for covered losses (41) (39) Additional paid - in capital 18,505 16,721 Accumulated income 15,513 14,088 Accumulated other comprehensive income (loss), net: Investment securities 1 3 Defined benefit pension and other postretirement plans (192) (196) Derivative instruments (310) (291) Foreign currency translation adjustments 873 838 Total ac cumulated other comprehensive income (loss), net 372 354 Total equity 37,696 36,210 Total liabilities and equity $ 80,195 $ 80,919 7 Visa Inc. Consolidated Statements of Operations (unaudited) Three Months Ended March 31, Six Months Ended March 31, 2021 2020 2021 2020 (in millions, except per share data) Net revenues $ 5,729 $ 5,854 $ 11,416 $ 11,908 Operating Expenses Personnel 1,114 940 2,095 1,922 Marketing 206 235 411 509 Network and processing 179 183 352 364 Professional fees 82 103 165 209 Depreciation and amortization 201 192 398 374 General and administrative 363 269 566 582 Litigation provision 3 8 4 8 Total operating expenses 2,148
7 1,930 3,991 3,968
1,930 3,991 3,968 Operating income 3,581 3,924 7,425 7,940 Non - operating Income (Expense) Interest expense, net (121) (118) (257) (229) Investment income and other 168 23 208 92 Total non - operating income (expense) 47 (95) (49) (137) Income before income taxes 3,628 3,829 7,376 7,803 Income tax provision 602 745 1,224 1,447 Net income $ 3,026 $ 3,084 $ 6,152 $ 6,356 Basic Earnings Per Share Class A common stock $ 1.38 $ 1.39 $ 2.80 $ 2.85 Class B common stock $ 2.24 $ 2.25 $ 4.55 $ 4.62 Class C common stock $ 5.52 $ 5.54 $ 11.22 $ 11.40 Basic Weighted - average Shares Outstanding Class A common stock 1,695 1,703 1,695 1,708 Class B common stock 245 245 245 245 Class C common stock 11 11 11 11 Diluted Earnings Per Share Class A common stock $ 1.38 $ 1.38 $ 2.80 $ 2.85 Class B common stock $ 2.24 $ 2.25 $ 4.54 $ 4.62 Class C common stock $ 5.52 $ 5.54 $ 11.20 $ 11.38 Diluted Weighted - average Shares Outstanding Class A common stock 2,193 2,228 2,196 2,234 Class B common stock 245 245 245 245 Class C common stock 11 11 11 11 8 Visa Inc. Consolidated Statements of Cash Flows (unaudited) Six Months Ended March 31, 2021 2020 (in millions) Operating Activities Net income $ 6,152 $ 6,356 Adjustments to reconcile net income to net cash provided by (used in) operating activities: Client incentives 3,850 3,453 Share - based compensation 275 215 Depreciation and amortization of property, equipment, technology and intangible assets 398 374 Deferred income taxes (27) (37) VE territory covered losses incurred (17) (13) Other (220) (84) Change in operating assets and liabilities: Settlement receivable (127) 1,642 Accounts receivable (165) 38 Client incentives (3,26
8 2) (4,323) Other assets (11
(4,323)
Other assets
(11")
2) (4,323) Other assets (116) (496) Accounts payable (41) 14 Settlement payable 210 (2,165) Accrued and other liabilities (39) 303 Accrued litigation (29) 65 Net cash provided by (used in) operating activities 6,842 5,342 Investing Activities Purchases of property, equipment and technology (318) (407) Investment securities: Purchases (2,015) (499) Proceeds from maturities and sales 3,871 3,420 Acquisitions, net of cash acquired (75) (77) Purchases of / contributions to other investments (30) (30) Other investing activities 41 34 Net cash provided by (used in) investing activities 1,474 2,441 Financing Activities Repurchase of class A common stock (3,509) (5,503) Repayments of debt (3,000) — Dividends paid (1,404) (1,339) Proceeds from issuance of commercial paper — 1,001 Cash proceeds from issuance of class A common stock under employee equity plans 108 109 Restricted stock and performance - based shares settled in cash for taxes (140) (155) Net cash provided by (used in) financing activities (7,945) (5,887) Effect of exchange rate changes on cash, cash equivalents, restricted cash and restricted cash equivalents 16 88 Increase (decrease) in cash, cash equivalents, restricted cash and restricted cash equivalents 387 1,984 Cash, cash equivalents, restricted cash and restricted cash equivalents at beginning of period 19,171 10,832 Cash, cash equivalents, restricted cash and rest ricted cash equivalents at end of period $ 19,558 $ 12,816 Supplemental Disclosure Cash paid for income taxes, net $ 1,505 $ 1,691 Interest payments on debt $ 340 $ 269 Accruals related to purchases of property, equipment and technology $ 17 $ 42 9 Visa Inc. Fiscal 202and 20Quarterly Results of Operations (unaudited) Fiscal 2021 Quarter Ended Fiscal 2020 Quarter Ended March 31, 2021 December 31, 2020 September 30, 2020 June 30, 2020 March 31, 2020 (in millions) Net revenues $ 5,729 $ 5,687 $ 5,101 $ 4,837 $ 5,854 Operating Expenses Personnel 1,114 981 922 941 940 Marketing 206 205 288 174 235 Network and processing 179 173 191
9 172 183 Professiona
172 183 Professional fees 82 83 104 95 103 Depreciation and amortization 201 197 196 197 192 General and administrative 363 203 256 258 269 Litigation provision 3 1 2 1 8 Total operating expenses 2,148 1,843 1,959 1,838 1,930 Operating income 3,581 3,844 3,142 2,999 3,924 Non - operating Income (Expense) Interest expense, net (121) (136) (145) (142) (118) Investment income and other 168 40 58 75 23 Total non - operating income (expense) 47 (96) (87) (67) (95) Income before income taxes 3,628 3,748 3,055 2,932 3,829 Income tax provision 602 622 918 559 745 Net income $ 3,026 $ 3,126 $ 2,137 $ 2,373 $ 3,084 10 Visa Inc. Reconciliation of NonGAAP Financial Results (unaudited)We use nonGAAP financial measures of our performance which exclude certain items which we believe are not representative of our continuing operations, as they may be nonrecurring or have no cash impact, and may distort our longerterm operating trends. We consider nonGAAP measures useful to investors because they provide greater transparency into management’s view and assessment of our ongoing operating performance.Gains and losses on equity investments. Gains and losses on equity investments include periodic noncash fair value adjustments and gains and losses upon sale of an investment.These longterm investments are strategic in nature and are primarily private company investments. Gains and losses and the related tax impacts associated with these investments are tied to the performance of thecompanies that we invest inand therefore do not correlate to the underlying performance of our business.Amortization of acquired intangible assets. Amortization of acquired intangible assets consists of amortization of intangible assets such as developed technology, customer relationships and brands acquired in connection with business combinations executed beginning in fiscal 2019. Amortization charges for our acquired intangible assets are noncash and are significantly affected by the timing, frequency and size of our acquisitions, rather than our core operations. As such, we have excluded this amount and the related tax impact to facilitate an evaluation of our current operating performance and comparison toour p
10 ast operating performance.Acquisitionrel
ast operating performance.Acquisitionrelated costs. Acquisitionrelated costs consist primarily of onetime transaction and integration costs associated with our business combinations. These costs include professional fees, technology integration fees, restructuring activities and other direct costs related to the purchase and integration of acquired entities. It also includes retention equity and deferred equity compensation when they are agreed upon as part of the purchase price of the transactionbut are required to be recognized as expense postcombination. We have excluded these amounts and the related tax impacts as the expenses are recognized for a limited duration and do not reflect the underlying performance of our business.Indirect taxes. During the three and six months ended March31, 2021, we recognized a onetime charge within general and administrative expense of $152 million, before tax. Net of the related income tax benefit of $40 million, determined by applying applicable tax rates, nonGAAP net income increased by $112 million. This charge is to record our estimate of probable additional indirect taxes, related to prior periods, for which we could be liable as a result of certain changes in applicable law. This onetime charge is notrepresentative of our ongoing operations. 11 Visa Inc. Reconciliation of NonGAAP Financial Results continued(unaudited)NonGAAP operating expense, nonoperating income (expense), income tax provision, effective income tax rate, net income and diluted earnings per shareshould not be relied upon as substitutes for, or considered in isolation from, measures calculated in accordance with U.S. GAAP. The following tables reconcile our asreported financial measures, calculated in accordance with U.S. GAAP, to our respective nonGAAP financial measures for the three and six months ended March31, 2021 and 2020. Three Months Ended March 31, 2021 Operating Expenses Non - operating Income (Expense) Income Tax Provision Effective Income Tax Rate (1) Net Income Diluted Earnings Per Share (1) (in millions, except percentages and per share data) As reported $ 2,148 $ 47 $ 602 16.6 % $ 3,026 $ 1.38 ( Gains) Losses on equity investments, net — (156) (35) (121) (0.05) Amortization of acquired intangible assets (13) — 3 10 — Acquisition - related costs (5) — 1 4 — Indirect taxes (152) — 40 112 0.05 Non - GAAP $ 1,978 $ (109) $ 611 16.8 % $ 3,031
11 $ 1.38 Six Months Ended
$ 1.38 Six Months Ended March 31, 2021 Operating Expenses Non - operating Income (Expense) Income Tax Provision Effective Income Tax Rate (1) Net Income Diluted Earnings Per Share (1) (in millions, except percentages and per share data) As reported $ 3,991 $ (49) $ 1,224 16.6 % $ 6,152 $ 2.80 ( Gains) Losses on equity investments, net — (172) (39) (133) (0.06) Amortization of acquired intangible assets (25) — 6 19 0.01 Acquisition - related costs (8) — 2 6 — Indirect taxes (152) — 40 112 0.05 Non - GAAP $ 3,806 $ (221) $ 1,233 16.7 % $ 6,156 $ 2.80 Three Months Ended March 31, 2020 Operating Expenses Non - operating Income (Expense) Income Tax Provision Effective Income Tax Rate (1) Net Income Diluted Earnings Per Share (1) (in millions, except percentages and per share data) As reported $ 1,930 $ (95) $ 745 19.4 % $ 3,084 $ 1.38 ( Gains) Losses on equity investments, net — 2 — 2 — Amortization of acquired intangible assets (11) — 2 9 — Acquisition - related costs (5) — 2 3 — Non - GAAP $ 1,914 $ (93) $ 749 19.5 % $ 3,098 $ 1.39 Six Months Ended March 31, 2020 Operating Expenses Non - operating Income (Expense) Income Tax Provision Effective Income Tax Rate (1) Net Income Diluted Earnings Per Share (1) (in millions, except percentages and per share data) As reported $ 3,968 $ (137) $ 1,447 18.5 % $ 6,356 $ 2.85 ( Gains) Losses on equity investments, net — (11) (3) (8) — Amortization of acquired intangible assets (22) — 5 17 0.01 Acquisition - related costs (7) — 2 5 — Non - GAAP $ 3,939 $ (148) $ 1,451 18.6 % $ 6,370 $ 2.85 (1)Figures in the table may not recalculate exactly due to rounding. Effective income tax rate, diluted earnings per share and their respective totals are calculated based on unrounded numbers