
Universidad Carlos III de Madrid 2010630 1 DK Lee Keon Jang Changhyun Lee Gianluca Iannaccone Kenjiro Cho Sue Moon Associate Professor Department of Computer Science Questions we need to answer first ID: 297693
Download Presentation The PPT/PDF document "Has the Internet Delay Gotten Better or ..." is the property of its rightful owner. Permission is granted to download and print the materials on this web site for personal, non-commercial use only, and to display it on your personal computer provided you do not modify the materials and that you retain all copyright notices contained in the materials. By downloading content from our website, you accept the terms of this agreement.


Slide1
Has the Internet Delay Gotten Better or Worse?
Universidad Carlos III de Madrid2010.6.30.
1
DK Lee, Keon Jang, Changhyun Lee, Gianluca Iannaccone, Kenjiro Cho
Sue Moon
Associate Professor
Department of Computer ScienceSlide2
Questions we need to answer first
Define Internet delay
Random sampling of Internet hostsEstimate accuracy
2Slide3
#1 Definition of Internet delay
Delay distribution of host pairs in the Internet
3Slide4
#2 Random sampling
Issues in random sampling of IP addressesNot all ASes have the same-size blocks of IP addresses
Not all blocks of IP addresses are in useNot all IP addresses are in useNot all IP addreses are always in use
=> /24 block as a unit of random sampling
4Slide5
#3 Accuracy of estimates
iPlane has shown better performance than landmark-based estimatesAll known delay estimation methodologies require some form of active in-situ measurement but "path stitching"
5Slide6
Path:
Delay:
r
A
+
r
AB
+
r
B
+
r
BC
+
r
C
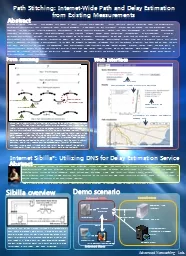
Overview of Path Stitching
Router-level paths and RTT from a to c ?
a
c
A
C
Step 1. IP-to-AS mapping
A
C
Step 2. AS-level path inference from
A
to
c
B
Step 3. Stitching path segments
:A:
A::B
B::C
:B:
:C:
r
A
r
AB
r
B
r
BC
r
CSlide7
What If There Are
7
March 15, 2010, dklee@an.kaist.ac.kr
A::B ?
B::C
:A:
:C:
:B: ?
...
...
Too few segments:
Too
many segments: Slide8
When path stitching produces no stitched path
Case #1: No path segments in source or destination AS
Case #2: No segments in the middle of inferred AS pathinter-domain: use reverse segmentintra-domain: no solutionCase #3: Segments does not rendezvous at the same address
Use approximationSlide9
When path stitching produces multiple stitched paths
Use preferences rules#1 Same destination-bound prefix
#2 Closeness to source and destination#3 Most recent vs medianSlide10
Comparison with iPlane
10
Very promising results:
With accurate AS paths inference,
errors <= 20ms for 80% of pl-hard pairsSlide11
Now we ask the question again:
Has it gotten better or worse?
11Slide12
Review of random /24 prefixes
12Slide13
BGP RIB Entries
13
http://bgp.potaroo.net/Slide14
# of /24 blocks in the BGP tables
14Slide15
Graphical distribution of
host pairs (AS: Asia, AF: Africa, EU: Europe, OC: Oceania, NA: North America, SA: South America)
15Slide16
Varying sample sizes
16Slide17
Response rates (n = 10,000)
17Slide18
Our data set
CAIDA's Skitter/Ark from 2004RouteView and RIPE BGP tables
18Slide19
Chronicle of Ark monitors
19Slide20
Delay distribution between random pairs of hosts
in 2004 and 2009
20Slide21
2004 vs. 2009
21
/21
Delay distribution has gotten worse from 2004 to 2009
(Median delay 164.0
msec
211.6
msec
)
IP/AS hop counts decreased end-to-endSlide22
Regional Growth of the Internet
22
/21
Fraction of host pairs in NA decreased significantly from 40 % to 20%
Fractions of all other regional pairs increased
NA: North America
SA: South America
AS: Asia
EU: Europe
OC: Oceania
AF: AfricaSlide23
Delay Distributions for
NA-NA and AF-EU pairs
23/21
Delays distributions for NA pairs in 2004 and 2009 are almost identical
Delay performance for AF-EU pairs for most part improved
10% of AF-EU pairs experience delays more than 1 sec in 2009Slide24
For the same pairs of hosts
in 2004 and 2009
24Slide25
2004 vs. 2009
25
/21
Delay distributions for the same set of sample host pairs
remain almost identical of slightly improved
IP/AS hop counts decreasedSlide26
Concluding Remarks
We present the methodology for the Internet delay history reconstruction and analysis:
Path stitching with existing measurementsRandom sampling of the Internet host pairsWe demonstrate the our approach is feasible in showing insight about the overall Internet delay distribution.
Future work will focus on:
Rigorous statistical analysis about the sources of errors
Trends from 1999 to 2009
Match the trend with the Internet-wide upgrades
Find the corroborating evidences for the observations
26
/21Slide27
BACKUP SLIDES
27Slide28
Internet-wide Coverage:
Approximations
28
pl-easy pairs
pl-hard pairs
we show incremental improvement in the fraction of pairs with stitched paths from 5% to 70% (for pl-hard pairs)Slide29
Preference Rules – (1)
29
Pair #
N
0
Delay (ms)
Delay (ms)
Delay (ms)
pl-easy pairs
pl-hard pairs
estimated delay (min)
without preference rules
real delay (max)
real delay (min)
estimated delay (max)
without preference rules
proximity+dst.bound
(min)
proximity+dst.bound
(max)
All three rules
Preference rules bring the estimated delays close
to the real measurementsSlide30
Delay distributions, from 2005 to 2009 in comparison with 2004 (Different pairs)
30Slide31
Median Delays
from 2004 to 2009
31Slide32
Delay distributions, from 2005 to 2009 in comparison with 2004
(Same pairs)
32Slide33
End-to-end delay performance for specific pairs
33