
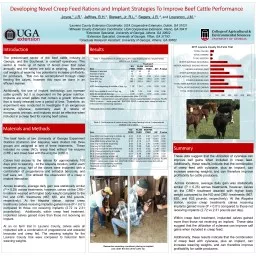
September 22 nd 2016 Philipe Moriel PhD Assistant Professor Beef Cattle Nutrition Range Cattle Research amp Education Center University of Florida Ona FL BOVINE RESPIRATORY DISEASE ID: 756458
Download Presentation The PPT/PDF document "Pre- and post-weaning calf nutrition" is the property of its rightful owner. Permission is granted to download and print the materials on this web site for personal, non-commercial use only, and to display it on your personal computer provided you do not modify the materials and that you retain all copyright notices contained in the materials. By downloading content from our website, you accept the terms of this agreement.


Slide1
Pre- and post-weaning calf nutrition September 22nd, 2016
Philipe Moriel, PhDAssistant Professor – Beef Cattle NutritionRange Cattle Research & Education CenterUniversity of Florida, Ona, FLSlide2
BOVINE RESPIRATORY DISEASE$ 800 to 900 million Losses annually (Chirase and Greene, 2001; Anim. Feed Sci 93:217-228)Number or treatments and income loss
1 treatment = decrease return by $412 treatments = decrease return by $58
3 or + = decrease by over $292
Fulton et al. (2002) J. Vet. Diagn. Invest. 12:33–38Slide3
Healthy calvesSick calvesNumber of cattle12,3064,047Medicine treatment cost, $/hd
027.03ADG, Lb2.992.67Net return,
$/hd67
-20.28
USDA Choice or higher, %
39.6
27.5
McNeil et al. (2000) http://animalscience-extension.tamu.edu/frameset.html
Effects of sickness on performance and profitability in the feedlotSlide4
Healthy calvesSick calvesNumber of cattle12,3064,047Medicine treatment cost, $/hd
027.03ADG, Lb2.992.67Net return,
$/hd
67
-20.28
USDA Choice or higher, %
39.6
27.5McNeil et al. (2000) http://animalscience-extension.tamu.edu
/frameset.htmlEffects of sickness on performance and profitability in the feedlotSlide5
Duff and Galyean (2007) JAS 85:823–840 Slide6
Immune SystemSlide7
Immune SystemSlide8
Dietary amino acids (AA)
Muscle AA mobilization
Adapted from Carroll and Fosberg (2007)
Vet. Clin. Food Anim. 23:105-149
Antigen
Acute-phase ResponseSlide9
AntigenAdapted from Carroll and Fosberg (2007)Vet. Clin. Food Anim. 23:105-149
Acute-phase Response
Acute-phase proteins
APPSlide10
Antigen
Adapted from Carroll and Fosberg (2007)Vet. Clin. Food Anim. 23:105-149
Acute-phase Response
Acute-phase proteins
APP
Tissue repair, coagulation, metal binding and transport proteinsSlide11
Immunological challengeSlide12
StressAntigen
Adapted from Carroll and Fosberg (2007)
Vet. Clin. Food Anim. 23:105-149
Acute-phase Response
Acute-phase proteins
APP
Tissue repair, coagulation, metal binding and transport proteinsSlide13
Dietary amino acids (AA)
Muscle AA mobilization
Stress
Antigen
Adapted from Carroll and
Fosberg
(2007)
Vet.
Clin
. Food Anim. 23:105-149
Acute-phase Response
Acute-phase proteins
APP
Tissue repair, coagulation, metal binding and transport proteinsSlide14
Stress and immune functionSlide15
“Fight or Flight response”Slide16
Carrol and Forsberg (2007) Vet Clin Food Anim 23:105-149 Slide17
NC STATE
UNIVERSITYSlide18
WeaningSlide19
WeaningSlide20
Creep-feedingPre-weaning performanceSlide21
Unlimited and limited creep-feeding increased weaning weightsStricker et al., 1979 Hixon et al., 1982 Lusby and Wettemann, 1986 Faulkner et al., 1994
Sexten et al., 2004 Moriel and Arthington, 2013a,bWhich one to use? Slide22
No CreepLimited creep
Unlimited creepSup. intake, Lb
/calf/
day
0
2.2
5.0
Sup. intake (84 days), Lb
0
187
422
Sup. cost @
$0.19/Lb, $/head
0
$35.51
$80.15
Initial weight, Lb
319
297
297
Final weight, Lb
484
525
555
Weight gain, Lb
165
228
258
Added gain, Lb
.
63
93
Feed conversion of added gain
2.9
4.5
Cost of added gain, $/Lb
$0.56
0.86
Income, $/calf
$1,016.70
$1,103.19
$1,166.10
Return, $/calf
$1,016.70
$1,067.69
$1,085.95
Adapted from Faulkner et al. (1994) JAS 72:470-477
Faulkner et al. (1994) JAS
72:470-477. Slide23
No CreepLimited creep
Unlimited creepSup. intake, Lb
/calf/
day
0
2.2
5.0
Sup. intake (84 days), Lb
0
187
422
Sup. cost @
$0.19/Lb, $/head
0
$35.51
$80.15
Initial weight, Lb
319
297
297
Final weight, Lb
484
a
525
b
555
c
Weight gain, Lb
165
a
228
b
258
c
Added gain, Lb
.
63
93
Feed conversion of added gain
2.9
4.5
Cost of added gain, $/Lb
$0.56
0.86
Income, $/calf
$1,016.70
$1,103.19
$1,166.10
Return, $/calf
$1,016.70
$1,067.69
$1,085.95
Adapted from Faulkner et al. (1994) JAS 72:470-477
Faulkner et al. (1994) JAS
72:470-477. Slide24
No CreepLimited creep
Unlimited creepSup. intake, Lb
/calf/
day
0
2.2
5.0
Sup. intake (84 days), Lb
0
187
422
Sup. cost @
$0.19/Lb, $/head
0
$35.51
$80.15
Initial weight, Lb
319
297
297
Final weight, Lb
484
a
525
b
555
c
Weight gain, Lb
165
a
228
b
258
c
Added gain, Lb
.
63
93
Feed conversion of added gain
2.9
4.5
Cost of added gain, $/Lb
$0.56
0.86
Income, $/calf
$1,016.70
$1,103.19
$1,166.10
Return, $/calf
$1,016.70
$1,067.69
$1,085.95
Adapted from Faulkner et al. (1994) JAS 72:470-477
Faulkner et al. (1994) JAS
72:470-477. Slide25
No CreepLimited creep
Unlimited creepSup. intake, Lb
/calf/
day
0
2.2
5.0
Sup. intake (84 days), Lb
0
187
422
Sup. cost @
$0.19/Lb, $/head
0
$35.51
$80.15
Initial weight, Lb
319
297
297
Final weight, Lb
484
a
525
b
555
c
Weight gain, Lb
165
a
228
b
258
c
Added gain, Lb
.
63
93
Feed conversion of added gain
2.9
4.5
Cost of added gain, $/Lb
$0.56
0.86
Income, $/
calf @1.30/
lb
$629.20
$682.50
$721.50
Return, $/calf
$629.20
$646.99
$641.35
Adapted from Faulkner et al. (1994) JAS 72:470-477
Faulkner et al. (1994) JAS
72:470-477. Slide26
Treatment
ItemNon-sup
Limit creep-fed
SEM
P-value
Calf BW,
lb
d 0
289
291
8.4
0.76
d 102
482
504
9.3
0.05
Calf ADG,
lb
/d
d 0 to 102
1.89
2.07
0.066
0.07
Supplement DMI,
lb
/d
d 0 to 102
0
35.7
Adapted from Faulkner et al. (1994) JAS 72:470-477
Moriel and
Arthington
(2013) JAS 91:1371–1380Slide27
Treatment
ItemNon-sup
Limit creep-fed
SEM
P-value
Calf BW,
lb
d 0
289
291
8.4
0.76
d 102
482
504
9.3
0.05
Calf ADG,
lb
/d
d 0 to 102
1.89
2.07
0.066
0.07
Supplement DMI,
lb
/d
d 0 to 102
0
35.7
Adapted from Faulkner et al. (1994) JAS 72:470-477
Moriel and
Arthington
(2013) JAS 91:1371–1380
+0.18
lb
/d added gainSlide28
Treatment
ItemNon-sup
Limit creep-fed
SEM
P-value
Calf BW,
lb
d 0
289
291
8.4
0.76
d 102
482
504
9.3
0.05
Calf ADG,
lb
/d
d 0 to 102
1.89
2.07
0.066
0.07
Supplement DMI,
lb
/d
d 0 to 102
0
35.7
Supplement cost $/head @$0.19/
lb
0
$6.78
Income added gain, $/head @$1.30/
lb
0
$23.87
Net return, $/head
0
$17.09
Adapted from Faulkner et al. (1994) JAS 72:470-477
Moriel and
Arthington
(2013) JAS 91:1371–1380
+0.18
lb
/d added gainSlide29
Creep-feedingPost-weaning performanceSlide30
Post-weaning performanceNo CreepUnlimited
creep (45 days)ADG, Lb/d (29 days post-weaning)
1.94
a
2.31
b
Concentrate intake, % of BW
Week 1
1.30
a
1.62
b
Week
2
2.04
2.13
Week 3
2.28
2.26
Hay intake, % of BW
Week 1
0.66
a
0.42
b
Week
2
0.57
0.47
Week 3
0.47
0.45
Adapted from Arthington et al. (2008) JAS 86:2016-2023Slide31
Carcass weight Creep vs. non-creep fed steersLancaster et al. (2007a,b) Greater for creep-fed in year 1, but not year 2Faulkner et al. (1994) Greater for creep-fed
Similar for creep-fed and non-creep fedTarr et al., 1994 Myers et al., 1999 Shike
et al., 2007 Slide32
Preconditioning Beef CalvesSlide33
Precondition = “to condition, train, or accustom in advance” American Heritage DictionaryNo standardized definition as it applies to beef cattle before, during, and/or after weaning and shipping
Management practices around weaning time Optimize animal’s immune system and healthMinimize stress Lalman and Smith ANSI-3529Slide34
Arthington et al. (2008) JAS 86:2016-2023Slide35
PRECODITIONING VS. NON-PRECONDITIONING Adapted from Roeber et al. (2001) Prof. Anim. Sci. 17:39–44 Slide36
Benefits for producersGreater weight gain before shippingReputation for high quality cattle Lalman
and Smith ANSI-3529Slide37
Preconditioning Scenarios Slide38Slide39
North Carolina State University research
NC STATE
UNIVERSITYSlide40
Dietary amino acids (AA)
Muscle AA mobilization
Stress
Antigen
Adapted from Carroll and
Fosberg
(2007)
Vet.
Clin
. Food Anim. 23:105-149
Acute-phase Response
Acute-phase proteins
APP
Tissue repair, coagulation, metal binding and transport proteinsSlide41
NC STATE
UNIVERSITY
Experiment 1 – Dietary Protein Concentration
July 2014
Increasing protein concentration
45-day preconditioning program
Increase Weaning weights??
Pay for extra cost of increase protein concentration??
Slide42
WeaningD -6
D 0
Feedlotentry
D 42
Feedlot
exit
DIETS: limit-fed at 2.2% of BW, DM basis
Treatments
NC STATE
UNIVERSITYSlide43
NC STATE
UNIVERSITY
Experiment 1 – Dietary Protein Concentration
MP = Metabolizable Protein requirementsSlide44
NC STATE
UNIVERSITY
Treatment
Item
85% MP
100% MP
115% MP
ADG,
lb
/day
1.83
2.64
2.97
Total weight
gain,
lb
77
110
126
Total feed intake,
lb
405
482
522
Total feed cost,
$/head
$ 60.75
$ 72.30
$ 78.15
Labor
and vaccine, $/head
$ 15.00
$ 15.00
$ 15.00
Total cost, $/head
$ 75.15
$ 89.30
$ 93.15
Cost of gain, $/
lb
of gain
$ 0.98
$ 0.81
$ 0.74
Income, Calf gain @ $1.30/
lb
$ 100.10
$ 143.00
$ 163.80
Net return, $/calf
$ 24.95
$ 53.70
$ 70.65
Return compared to 100% MP
- $ 28.75
*
$ 16.95Slide45
Plasma cortisol, ng/mL
NC STATE
UNIVERSITY
Trt
x time:
P
= 0.07
a
a
a
b
ab
a
a
a
a
a
a
a
a
a
a
b
ab
a
a
a
a
a
a
a
a
a
a
a
a
a
*Vaccination
*
*Slide46
Titers, log2 - Bovine viral diarrhea virus type 1b
NC STATE
UNIVERSITY
Trt
x time:
P
= 0.03
a a a
a a a
a a bSlide47
Frequency of concentrate supplementation during preconditioning
NC STATE
UNIVERSITY
Artioli et al. (2015)
.
J. Anim. Sci.
doi
: 10.2527/jas2015-9457
Major concern:
Feeding costs and labor
Concentrate supplementation
3 vs. 7 days per week
P
roject
#2014
-1885
“
The effects of frequency of energy supplementation during preconditioning on growth and immunity of beef steers”
Role: PI
Period
: 1/1/2014 to 12/31/2014
Agency
: NC Cattlemen’s
Association Amount
: $
6,888
Agency:
Zoetis Animal Health Amount
:
$5,000
Mon
Tue
Wed
Thru
Fri
Sat
Sun
TOTAL
--------------- Concentrate offer ---------------
Supp. 7x
3 kg
3 kg
3 kg
3 kg
3 kg
3 kg
3 kg
21 kg
Supp. 3x
7
kg
7
kg
7
kg
21 kgSlide48
Frequency of concentrate supplementation during preconditioning
NC STATE
UNIVERSITY
Artioli et al. (2015)
.
J. Anim. Sci.
doi
: 10.2527/jas2015-9457
Forage Intake
Supplementation
Supplementation
Supplementation
Sun
Daily supp.
Mon
Tue
Wed
Thu
Fri
SatSlide49
Frequency of concentrate supplementation during preconditioning
NC STATE
UNIVERSITY
Artioli et al. (2015)
.
J. Anim. Sci.
doi
: 10.2527/jas2015-9457
Forage Intake
Supplementation
Supplementation
Supplementation
Sun
Daily supp.
Mon
Tue
Wed
Thu
Fri
Sat
3x/weekSlide50
Frequency of concentrate supplementation
NC STATE
UNIVERSITY
Item
Supp
7x/
wk
Supp
3x/
wk
SEM
P-value
Initial
weight (d 0),
lb
480
480
15
0.94
Final
weight (d 42),
lb
601
575
18
0.34
ADG,
lb
/day
2.86
2.27
0.15
0.01
Total dry matter intake,
lb
419
366
18
0.02
Feed:Gain
3.48
3.84
0.11
0.09
Artioli et al. (2015)
.
J. Anim. Sci.
doi
: 10.2527/jas2015-9457Slide51
Frequency of concentrate supplementation
NC STATE
UNIVERSITY
Item
Supp
7x/
wk
Supp
3x/
wk
ADG,
lb
/day
2.86
2.27
Body weight gain,
lb
121
95
Feed cost, $/calf
$ 30.80
$ 26.83
Labor cost, $/calf
$ 6.00
$
3.00
Vaccine
cost, $/calf
$ 9.00
$ 9.00
Total cost, $/calf
$ 46
$ 39
Income,
calf gain @$1.30/kg
$ 157
$ 124
Return, $/calf
$ 111
$ 85
*
P
≤ 0.05
Artioli et al. (2015)
.
J. Anim. Sci.
doi
: 10.2527/jas2015-9457Slide52
Frequency of concentrate supplementation
NC STATE
UNIVERSITY
a-b
Within day, means without a common superscript differ (
P
≤ 0.05)
Trt
. x day:
P
=
0.05
Treatments
Item
S7
S3
SEM
P
-value
Bovine viral diarrhea virus type 1b
Seroconversion,
%
Trt
.
x day
d 21
12.8
a
20.5
a
8.81
0.06
d 42
100.0
b
78.8
a
Treatment
Mean
titers, log
2
2.51
1.46
0.306
0.03
Artioli et al. (2015)
.
J. Anim. Sci.
doi
: 10.2527/jas2015-9457Slide53
Frequency of concentrate supplementation during preconditioning
NC STATE
UNIVERSITY
Forage Intake
Supplementation
Supplementation
Supplementation
3x/week
at 1% of BW
Sun
Mon
Tue
Wed
Thu
Fri
SatSlide54
Frequency of concentrate supplementation during preconditioning
NC STATE
UNIVERSITY
Forage Intake
Supplementation
Supplementation
Supplementation
3x/week
at 1% of BW
3x/week
at 0.5% of BW
Sun
Mon
Tue
Wed
Thu
Fri
SatSlide55
1. Frequency vs. level of energy supplementation for preconditioning calves.Factorial design of frequency (7 vs. 3x/wk) vs. level (0.5 vs. 1.0% of BW) of supplementation
To be submitted to JAS in December 2015Funding source: “Enhancing the utilization of wet brewers grains by beef cattle producers”Role: PI
Amount: $16,000 Agency: New Belgium Brewery Company, Asheville, NC
Amount:
$5,000 Agency: Zoetis
Animal Health
NC STATE
UNIVERSITY
3x0.5 7x0.5 3x1.0 7x1.0
Moriel et al. (2016) J
.
Anim
.
Sci
.
94:3030–3041 Slide56
Frequency vs. level of energy supplementation for preconditioning calves.
NC STATE
UNIVERSITY
Freq. x day
P
= 0.06
Serum titers against Bovine Viral Diarrhea Virus type 1b on d 42
No serum BVDV1-b titers detected on d 0
Treatment
Item
3X0.5
7X0.5
3X1.0
7X1.0
SEM
P
-value
BW, kg
Freq. x rate x day
d 0
212
213
214
213
2
0.43
d 42
255
253
258
262
3.4
d 0 to 42
Freq. x rate
ADG, kg/d
1.01
0.96
1.04
1.15
0.104
0.43
Total DMI, kg
185
174
192
196
10.2
0.48
G:F
0.23
0.23
0.23
0.25
0.011
0.58
Moriel et al. (2016) J
.
Anim
.
Sci
.
94:3030–3041 Slide57
NC STATE
UNIVERSITYSlide58
NC STATE
UNIVERSITY
Treatment
P-value
Item
3X
7X-3X
7X
SEM
Trt
ADG,
lb
/d
d 0 to 43
1.89
2.12
1.96
0.137
0.44
Total DMI,
lb
/d
d 0 to 43
424
442
439
8.7
0.38
G:F
0.196
0.212
0.191
0.0135
0.57Slide59
NC STATE
UNIVERSITY
Treatment
P-value
Item
3X
7X-3X
7X
SEM
Trt
Day
Trt
x day
Haptoglobin
, mg/
dL
0.443a
0.370b
0.373b
0.025
0.04
<0.0001
0.94
Infectious bovine
rhinotracheitis
Serum titers, log2
0.29a
0.88b
0.79b
0.179
0.05
<0.0001
0.24
Parainfluenza-3
Seroconversion,
%
d 14
36.0a
76.6b
57.b
8.24
0.09
<0.0001
0.04
d 42
100.0
98.0
98.9
Slide60
Thank you
Philipe Morielpmoriel@ufl.edu