
DIA 1 SimplePCI D ynamic I ntensity A nalysis DIA utilizes multithreading for high speed processing and rapid measurement of cell intensity over time while viewing images and data on a time g ID: 947306
Download Pdf The PPT/PDF document "Quick Start Guide" is the property of its rightful owner. Permission is granted to download and print the materials on this web site for personal, non-commercial use only, and to display it on your personal computer provided you do not modify the materials and that you retain all copyright notices contained in the materials. By downloading content from our website, you accept the terms of this agreement.


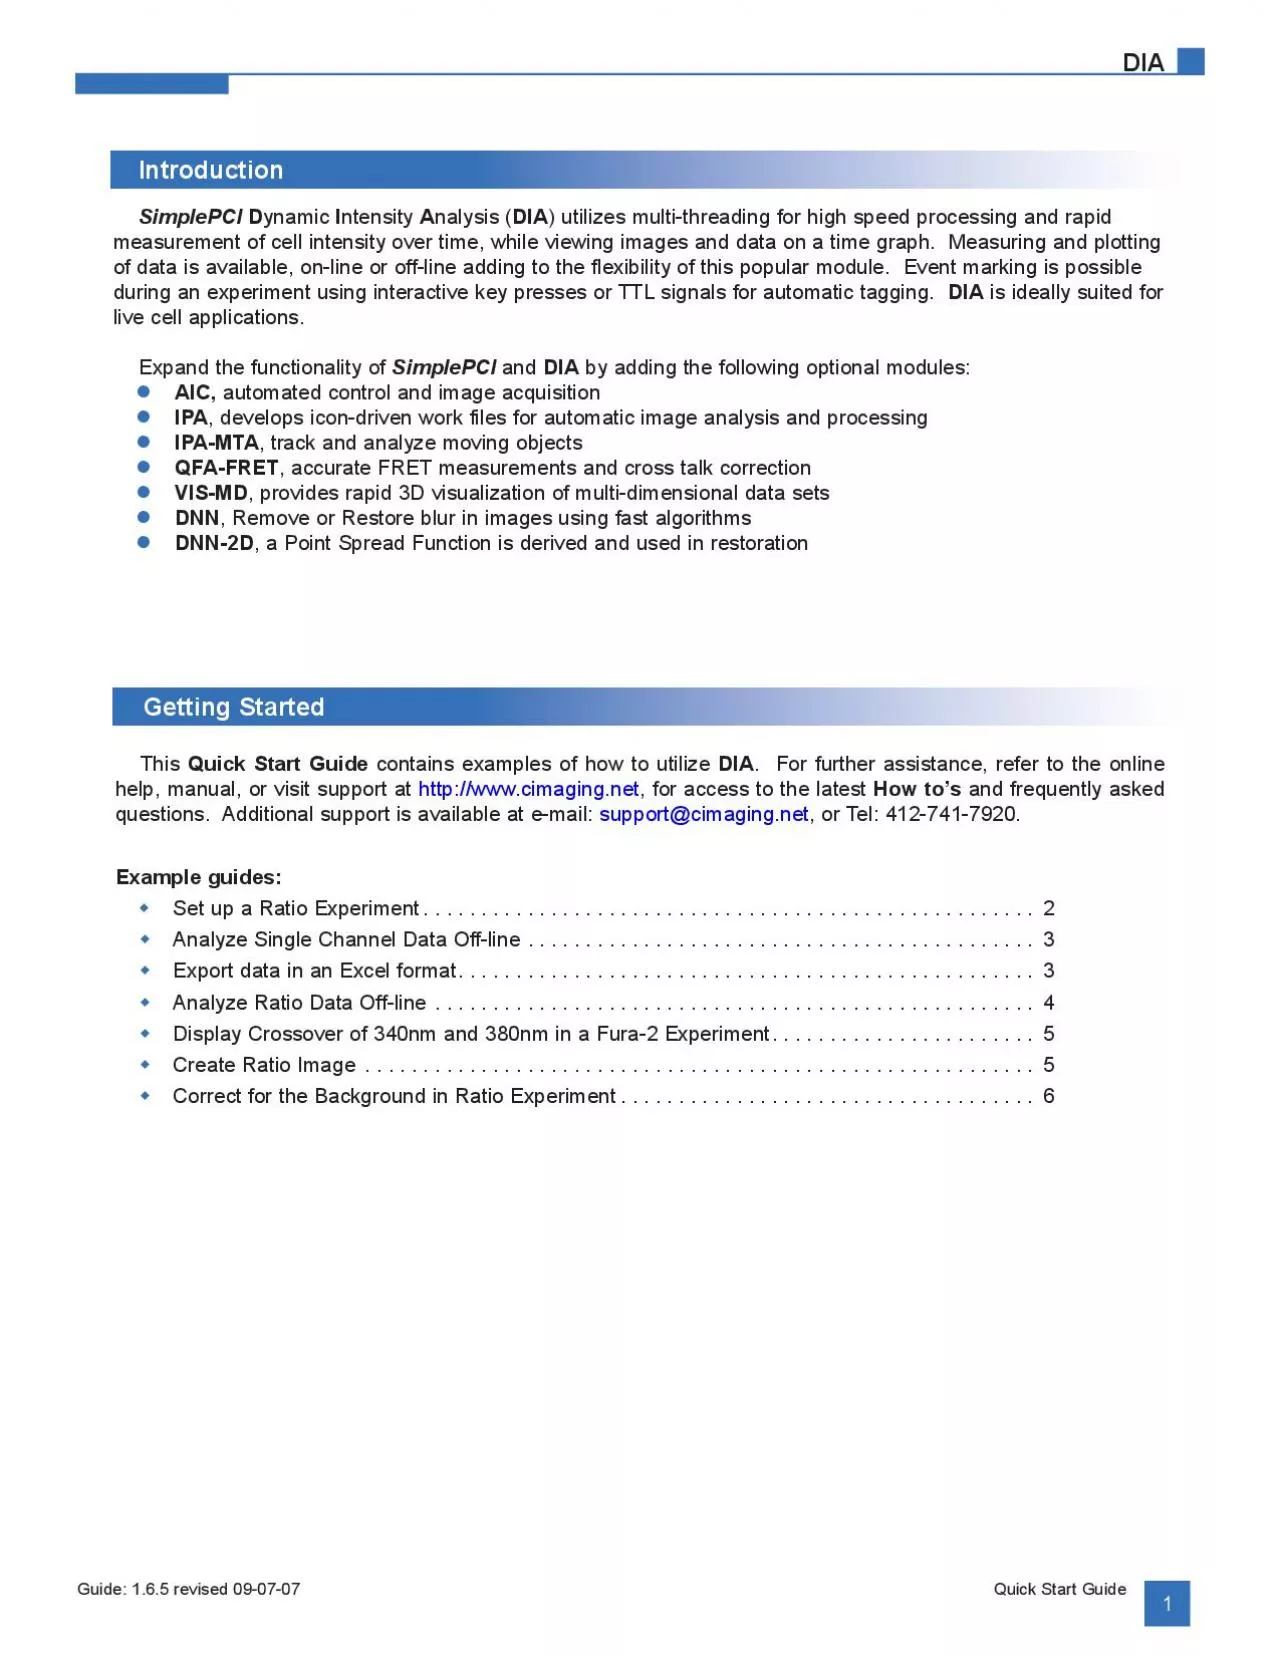
DIA Quick Start Guide 1 SimplePCI D ynamic I ntensity A nalysis ( DIA ) utilizes multi-threading for high speed processing and rapid measurement of cell intensity over time, while viewing images and data on a time graph. Measuring and plotting during an experiment using interactive key presses or TTL signals for automatic tagging. DIA is ideally suited for live cell applications. Expand the functionality of SimplePCI and DIA by adding the following optional modules: AIC, automated control and image acquisition IPA , develops icon-driven work files for automatic image analysis and processing IPA-MTA , track and analyze moving objects QFA-FRET , accurate FRET measurements and cross talk correction VIS-MD DNN , Remove or Restore blur in images using fast algorithms DNN-2D , a Point Spread Function is derived and used in restoration Guide: 1.6.5 revised 09-07-07 This Quick Start Guide contains examples of how to utilize DIA . For further assistance, refer to the online http://www.cimaging.net , for access to the latest How to’s and frequently asked questions. Additional support is available at e-mail: support@cimaging.net , or Tel: 412-741-7920. Example guides: Set up a Ratio Experiment ..................................................... 2 Analyze Single Channel Data Off-line ............................................ 3 Export data in an Excel format .................................................. 3 Analyze Ratio Data Off-line ..................................................
.. 4 Display Crossover of 340nm and 380nm in a Fura-2 Experiment ....................... 5 Create Ratio Image 5 Correct for the Background in Ratio Experiment .................................... 6 Introduction Getting Started DIA Quick Start Guide 2 1. Click on Camera Icon to activate the Capture menu ( fig.1 ). 2. Select your capture device from the top right drop-down menu. ( fig.1 ) Select number of Channels for image capture, one channel for single wavelength and two for ratio( fig.1 ) 3. Set camera binning, bit depth in Device Setup . 4. Select Filter Wavelength from the Filter Setup drop down menu ( fig.1. ) 5. Define Regions for measurement, with ROI ( fig.1 ) drawing tools and intensity threshold ( fig.2 ). Set Exposure to 50% of min/max intensity to give best image. Hint; where possible, keep gain and exposure identical 6. Click on New Scan to Start DIA dialogue � choose Time Scan and Intensity Monitor � Save ( fig.3 ) 7. Click Display Setup Tab to set up measurement parameters ( fig.4 ) 8. Select intensity measurement by clicking on the Measure icon ( fig.4A ) 9. Choose one or two Intensity Graph Display ( fig.4B ), typically one display for single wavelength and two displays for ratio 10. Set X and Y axis properties for intensity plot display ( fig.4C ). Save display and resource parameters ( fig.4D ) 11. Click Speed/Resource Tab to set up time-lapse delay ( fig.5 ) 12. Acquisition Speed : Enter user defined time intervals in Delay 1, 2 and 3, with options for Maximum speed ( fig.5A
) 13. User defined time intervals are available for dynamic selection during run ( fig.5B ). Image Display : Select method of Image Display ( fig.5C ) 15. Aquisition Control : Define Time for total length of run ( fig.5D ) 16. Click Save Scan to save current settings ( fig.5E ) 17. Click Intensity Plot Tab to view graph ( fig.6 ) 18. Click Start to begin image capture, measure and plot intensity over time ( fig.6 ) 19. Click Live Image to pause sequence and adjust focus, or move ROIs 20. During run add event markers by clicking on the event button ( fig.6D ) fig.1 fig.2 fig.3 fig.4 fig.5 A B C D A B C D E fig.6 A C D Set up a Ratio Experiment DIA Quick Start Guide 3 1. Open Data File. 2. Expand Field Data and select Original Image ( fig.1.A ) 3. Click the ROI icon to activate the drawing tools. Select a drawing tool ( fig.1.C ) and draw regions. Or select the Intensity threshold ( fig.1.D ) icon to threshold regions of interest. 4. Click Intensity Measurement icon ( fig.1.E ) and select intensity measurements, for example MEAN_GREY . Click Measure to analyze ROI’s through out the image sequence. 5. Select MEAN_GREY under Group 1 in Object Summary Graphs ( fig.2 ) 6. Choose All or Average ROI’s from Obj drop-down menu ( fig.2 ) 7. Zoom in/out of graph by clicking + dragging a selected area. Pan graph by dragging over a zoomed area. Click on the graph to return to normal view. 8. View Data in a form by selecting Spreadsheet View from the Graph View drop down menu 1. Ope
n Data File 2. Expand and highlight folder Object Summary Graph, to view MEAN_GREY ( fig.1 ) 3. Go to the Edit menu and select Copy to Excel. Excel will launch and a copy to the spreadsheet will appear. fig.1 fig.2 fig.1 A B C D E A B Analyze Single Channel Data Off-line Export Data into an Excel Format DIA Quick Start Guide 4 1. Open Data File. 2. Expand Field Data and select Original Image ( fig.1.A ) 3. Click the ROI icon ( fig.1.B ) to activate the drawing tools. Select a drawing tool ( fig.1.C ) and draw regions. Or select the Intensity threshold ( fig.1.D ) icon to automatically threshold regions of interest. 4. Click Intensity Measurement icon ( fig.1.E ) and select intensity measurements, for example MEAN_ Red , and MEAN_Green . Click Define to activate the Custom Intensity Measurement Menu , and customize measurements. If you don’t need to create custom measurements go to step 6. Custom Intensity Measurements Menu ( fig.2 ) allows you to customize DIA measurements to suit your application. For example, for a fura experiment, Mean_Red can be called 340nm . Click Add � type a name, 340nm, click on the expression M9:Mean_Red . Mean_Green can be called 380nm . Click Add � type 380nm, click on the expression M14:Mean_Green ( fig.2 ). Custom Measurement can be saved by clicking on the Save icon at the bottom left. Close the Custom Intensity Measurement Menu . 6 Select the created custom Measurements. Check Custom � check the custom measurements ( fig.3 7. Click
Measure to analyze ROI’s throughout the image sequence 8. Select 340nm , 380nm or Ratio under Group 1 in Object Summary Graphs ( fig.4 ) 9. Choose All or Average ROI’s from Obj drop-down menu. Click on any of the graph to split the data in dual view ( fig.4 ). You can also click + drag on any part of the graph to zoom in. fig.1 fig.2 fig.3 fig.4 A B C D E Analyze Ratio Data Off-line DIA Quick Start Guide 5 1. Open Data File 2. Select Group 1 in Object Summary Graphs ( fig.1.A ) 3. Choose Average ROI’s from Obj drop-down menu ( fig.1B ) 4. Click on Select Measurement Icon ( fig.1.C ) and check 340nm and 380nm ( fig.2 ) to view 340nm and 380nm average profiles. 1. Open Data File 2. Expand Field Data and select Original Image ( fig.1 ) 3. Click Merged Display Properties icon select A/B Ratio from the Merge Display pull-down. Enter Min Max value for best ratio display 4. Click Contrast Display Properties Select Pseudocolor Spectrum ( fig.2 ) from the drop-down list. 5. Adjust min/max contrast levels for best image display ( fig.3 ) fig.1 fig.1 fig.2 A B C A fig.2 fig.3 Display Crossover of 340nm and 380nm in a Fura-2 Experiment Create Ratio ImageFura-2 Experiment DIA Quick Start Guide 6 1. Open Data file 2. Expand Field Data and select Original Image ( fig.1.A ) 3. Click the ROI icon ( fig.1.B ) to activate the drawing tools. Select a drawing tool ( fig.1.C ) and draw regions. Or select the Intensity threshold ( fig.1.D ) icon to automatically threshold regions of inter
est. The first regions are automatically classified as Group 1. 4. Define ROI for the background in Group 2. Click on the Select Group icon in the ROIs toolbox. Select Add New Group � OK � Pick a color for the new group � OK 5. Draw a ROI on the background. Note: Increasing the image contrast will help define a good background region. 6. Click Intensity Measurement icon Click Define to activate the Custom Intensity Measurement Menu , and customize measurements. 7. Click Add in the Custom Object Measurement Menu and assign a name to your custom measurement. E.g. Corrected_Ratio ( fig.2 ) . 8. Create the following formula: (M9-cl2(mean(M9)) for the corrected 340nm or (Mean Red);and create the following formula (M16-cl2(mean(M16)) for the corrected 380 by clicking on the appropriate object measurements and operators (fig.2). 9.M8 is the Mean intensity in the Red channel, subtracted by -cls2(mean(M9)), the Mean intensity in the RED channel of class 2 or second group ( fig.2 ) 10. Click the Save icon to save the custom measurement and click OK . 11. Select the created custom Measurements. Check Custom � check the custom measurements ( fig.3 12. Click Measure to analyze ROI’s throughout the image sequence ( fig. 3 ) 13. Select Corr_340nm , Corr_380nm or Corr_Ratio under Group 1 in Object Summary Graphs ( fig.4 ) 14. Choose All or Average ROI’s from Obj drop-down menu ( fig.4 ) fig.1 fig.2 fig.3 fig.4 B C D A Correct for Image Background in a Ratio Experi