
Function in Adult Nigerians with Sickle Cell Anaemia Akinlade KS 1 Adewale CO 1 Fasola FA 2 Rahamon SK 1 Dada VO 3 1 Department of Chemical Pathology 2 Department of Haematology College of Medicine University of Ibadan ID: 780360
Download The PPT/PDF document "Insulin Sensitivity and β-cell" is the property of its rightful owner. Permission is granted to download and print the materials on this web site for personal, non-commercial use only, and to display it on your personal computer provided you do not modify the materials and that you retain all copyright notices contained in the materials. By downloading content from our website, you accept the terms of this agreement.


Slide1
Insulin Sensitivity and β-cell Function in Adult Nigerians with Sickle Cell Anaemia
Akinlade KS1, Adewale CO1, Fasola FA2, Rahamon SK1, Dada VO3 1Department of Chemical Pathology, 2Department of Haematology, College of Medicine, University of Ibadan, 3Department of Chemical Pathology, University College Hospital, Ibadan, Nigeria.
36th Annual General Meeting and Scientific Conference of the Endocrine and Metabolism Society of Nigeria, Benin City, 2014
Conference presentation
by
Sheu. K. RAHAMON
is licensed under a
Creative Commons Attribution-
NonCommercial
-
ShareAlike
4.0 International License
Slide2Background
Sickle cell anaemia (SCA) is a genetic disease of high morbidity and mortality worldwide (1). There is a clear role for inflammatory mediators in the pathogenesis of SCA (2, 3). Inflammation is likely triggered by the abnormal erythrocyte membrane and the presence of chronic haemolysis. The release of heme iron from lysed red blood cell (RBC) is a major cause of oxidative stress that can induce redox-sensitive transcription factors
which can upregulate the production of proinflammatory cytokines
which have been implicated in insulin resistance.
36th Annual General Meeting and Scientific Conference of the Endocrine and Metabolism Society of Nigeria, Benin City, 2014
Slide3The association between inflammation and insulin resistance has been widely reported (4, 5).
Specifically, phosphorylation of serine residues of insulin receptor substrate 1 (IRS-1) by the proinflammatory cytokines impedes the normal association of IRS-1 with the insulin receptor, thereby impairing downstream propagation of insulin signalling (6). 36th Annual General Meeting and Scientific Conference of the Endocrine and Metabolism Society of Nigeria, Benin City, 2014
Slide4However
, for reasons not yet known, the association of DM with SCA is uncommon (7). Clinical experience in tropical countries with a high incidence of SCA indicates that the concurrence of SCA with either type 1 or type 2 diabetes is not common (8, 9). A 5 year prospective, multicentre study reported that diabetes mellitus affects about 2% of individuals with SCA (10). These are unexpected observations as SCA is characterized by increased oxidative stress and inflammation (11),
all of which are important risk factors for insulin resistance development. This study therefore, assessed insulin secretion and sensitivity in adults with SCA.
36th Annual General Meeting and Scientific Conference of the Endocrine and Metabolism Society of Nigeria, Benin City, 2014
Slide5Subjects and Methods
After an approval from the University of Ibadan/University College Hospital (UI/UCH) Joint Ethics Review Committee (UI/EC/12/0194) and written informed consent from each participant, 30 adults with SCA in steady state and 25 age and BMI-matched healthy individuals with HbAA genotype were recruited into this study. Steady state subjects were those that have not had acute complicating factors or acute clinical symptoms or crisis in previous three months. This was established by a careful history and complete physical examination.
After an overnight fast of about 10 hr, 5 ml of venous blood was obtained from each participant for the determination of plasma glucose and serum insulin. Thereafter, each subject underwent a 75-g oral glucose tolerance test and 5 ml of venous blood was taken at 120 minutes for glucose and insulin estimation using glucose
oxidase method and ELISA respectively.
36th Annual General Meeting and Scientific Conference of the Endocrine and Metabolism Society of Nigeria, Benin City, 2014
Slide6Thereafter,
indices of insulin sensitivity and secretion were calculated appropriately.Homeostasis model assessment-estimated insulin resistance (HOMA-IR) = Fasting plasma insulin (µU/ml) x Fasting plasma glucose (mmol/l) 22.5Quantitative insulin sensitivity check index (QUICKI) = 1/[log I0 (μU/ml) + log G0 (mg/dl)]
Insulin sensitivity index proposed by Gutt et al. (12) (ISI-
Gutt) (mg.l2.mmol-1.mIU
-1.min-1) = 75,000 + (G0-G
120)(mg/dl) x 0.19 x body weight/120 x Gmean(0, 120) (mmol/l) x Log Imean(0, 120) (mU/l).
Insulin sensitivity index proposed by Avignon et al. (13) (Avignon index) = [(0.137 x Sib) + Si2 h]/2 where Sib = 108/(I0 (
mU
/l)
x G
0 (
mmol
/l)
x VD) and Si2 h = 10
8
/(I
120 (
mU
/l)
x G
120 (
mmol/l) x VD). VD = glucose distribution volume (150ml/kg body weight).
36th Annual General Meeting and Scientific Conference of the Endocrine and Metabolism Society of Nigeria, Benin City, 2014
Slide7Insulin sensitivity index proposed by
Stumvoll et al. (14) (ISI-Stumvoll) = 0.156 – 0.0000459 x I120 (pmol/l) – 0.000321 x I0 (pmol/l) – 0.00541 x G120 (mmol/l).First phase of insulin secretion (FPIS) = 2032 + 4.681 x I0(pmol/L) – 135.0 x G120(mmol
/L) + 0.995 x I120(pmol/L)
+ 27.99 x BMI – 269.1 x G0(mmol/L) (14).
Second phase of insulin secretion (SPIS) = 277 + 0.800 x I0(
pmol/L) – 42.79 x G120(mmol/L) + 0.321 x I120(pmol/L) + 5.338 x BMI (14).
Percentage increment of 120 min plasma glucose over fasting plasma glucose (PG%) = [(2hPG – FPG)/FPG] x 100 (15).Statistical analysis was done using independent Student’s t-test and Mann-Whitney U as appropriate.
P-
values less than 0.05 were considered
as statistically significant
.
36th Annual General Meeting and Scientific Conference of the Endocrine and Metabolism Society of Nigeria, Benin City, 2014
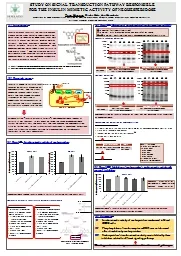
Slide8Results
36th Annual General Meeting and Scientific Conference of the Endocrine and Metabolism Society of Nigeria, Benin City, 2014
Slide936th Annual General Meeting and Scientific Conference of the Endocrine and Metabolism Society of Nigeria, Benin City, 2014
Slide10Discussion
The observed lower FPG (though still within the reference range) contradicts the reports of AlSultan et al. (11). Our observation could be due to increased energy expenditure and hypermetabolism usually found in subjects with SCA (7, 16).ISI-Gutt was significantly lower in SCA subjects compared with controls. Our observation could be as a result of increased inflammation and oxidative stress associated with SCA. Many lines of evidence have shown that chronic activation of intracellular proinflammatory pathways within insulin target cells can lead to insulin resistance (17).
Loss of first-phase secretion and reduced second-phase secretion have been reported to be key features of type 2 diabetes mellitus (T2DM) (18,19,20). The observed lower SPIS in SCA subjects compared with the control subjects might indicate impaired function of the reserve pool of β cell. The reserve pool (RP) accounts for the vast majority of insulin
secretory granules while the readily releasable pool (RRP) accounts for the remaining granules (less than 5%) (21).
PG% works on the physiological concept that the faster the post-load glucose fall towards FPG, the more efficient is β-cell function hence; higher PG% indicates higher β-cell dysfunction. Our observed higher PG% in SCA subjects might suggest impaired β-cell function, this is not surprising as endocrine and metabolic perturbations have been reported in individuals with SCA (7).
36th Annual General Meeting and Scientific Conference of the Endocrine and Metabolism Society of Nigeria, Benin City, 2014
Slide11Conclusion
It could be concluded from this study that SCA subjects seem to have an inconsistent picture of lower plasma glucose, β-cell dysfunction and relatively reduced insulin sensitivity when compared with HbAA subjects. The implication of these for future development of diabetes in individuals with SCA is presently unclear.LimitationsSmall sample size. Non-determination of ferritin and markers of oxidative stress and inflammation. 36th Annual General Meeting and Scientific Conference of the Endocrine and Metabolism Society of Nigeria, Benin City, 2014
Slide12References
Ohene-Frempong K, Nkurumah FK. Sickle cell disease in Africa. Raven press Ltd, New York, 1994.Kaul DK, Hebbel RP. Hypoxia/reoxygenation causes inflammatory response in transgenic sickle mice but not in normal mice. J Clin Invest 2000; 106:411-420.Akinlade KS, Atere AD, Olaniyi JA, Rahamon SK, Adewale CO. Serum Copeptin and Cortisol do not Accurately Predict Sickle Cell
Anaemia Vaso-occlusive Crisis as C-reactive protein. PLoS ONE 8(11): e77913.
Hotamisligil GS, Arner P, Caro JF, Atkinson RL,
Spiegelman BM. Increased adipose tissue expression of tumor necrosis factor-α in human obesity and insulin resistance. J. Clin
. Investig. 1995; 95:2409–2415.Schenk S, Saberi M, Olefsky JM: Insulin sensitivity: modulation by nutrients and inflammation. J Clin Investig 2008; 118:2992–3002.
Aguirre V, Werner ED, Giraud J, Lee YH, Shoelson SE, White MF. Phosphorylation of Ser307 in insulin receptor substrate-1 blocks interactions with the insulin receptor and inhibits insulin action. J Biol Chem 2002; 277(2):1531-1537.
Smiley D,
Dagogo
-Jack S,
Umpierrez
G. Therapy insight: metabolic and endocrine disorders in sickle cell disease. Nat
Clin
Pract
Endocrinol
Metab
. 2008; 4(2):102-109.
Reid HL,
Ene MD, Photiades DP,
Famodu
AA. Insulin-dependent diabetes mellitus in homozygous sickle cell anaemia.
Trop
Geogr
Med 1990; 42: 172–173.
Mohapatra
MK. Type 1 diabetes mellitus in homozygous sickle cell anaemia. J Assoc Physicians India 2005; 53: 895–896
Fung EB,
Harmatz
PR, Lee PD,
Milet
M, Bellevue R,
Jeng
MR,
Kalinyak
KA,
Hudes M, Bhatia S, Vichinsky EP; Multi-Centre Study of Iron Overload Research Group. Increased prevalence of ironoverload associated endocrinopathy in thalassaemia versus sickle cell disease. Br J Haematol 2006, 135: 574–582.Alsultan AI, Seif MA, Amin TT, Naboli M, Alsuliman AM. Relationship between oxidative stress, ferritin and insulin resistance in sickle cell disease. Eur Rev Med Pharmacol Sci. 2010; 14(6):527-538.Gutt M, Davis C L, Spitzer S B, Llabre M M, Kumar M, Czarnecki E M, Schneiderman N, Skyler J S, Marks J B. Validation of the insulin sensitivity index [ISI(0,120)]: comparison with other measures. Diabetes Res Clin Pract 2000; 47: 177–184.Avignon A, Boegner C, Mariano-Goulart D, Colette C, Monnier L. Assessment of insulin sensitivity from plasma insulin and glucose in the fasting or post oral glucose-load state. Int J Obes Relat Metab Disord 1999; 23: 512–517.Stumvoll M, Mitrakou A, Pimenta W, Jenssen T, Yki-Jarvinen H, Van Haeften T, Renn W, Gerich J. Use of oral glucose tolerance test to assess insulin release and insulin sensitivity. Diabetes Care 2000; 23: 295–301.Carnevale Schianca GP, Mella R, Scaglia E, Bigliocca M, Colli E, Fra GP, Bartoli E. Expanding the clinical use of standard OGTT: the percentage increment of 2 h with respect to fasting glucose as an index of β-cell dysfunction. Diabetes Metab Res Rev 2011; 27(3):262-268.Barden E M, Zemel B S, Kawchak D A, Goran M I, Ohene-Frempong K, Stallings V A. Total and resting energy expenditure in children with sickle cell disease. J Pediatr. 2000; 136(1):73-79.Facchini FS, Hua N, Abbasi F, Reaven GM. Insulin resistance as a predictor of age related diseases. J Clin Endocrinol Metab 2001; 86:3574-3578.Cerasi E, Luft R. The plasma insulin response to glucose infusion in healthy subjects and in diabetes mellitus. Acta Endocrinol (Copenh). 1967;55(2):278–304.Davis SN, Piatti PM, Monti L, Brown MD, Branch W, Hales CN, Alberti KG. Proinsulin and insulin concentrations following intravenous glucose challenges in normal, obese, and non-insulin-dependent diabetic subjects. Metabolism. 1993;42(1):30–35.Seino S, Shibasaki T, Minami K. Dynamics of insulin secretion and the clinical implications for obesity and diabetes. J Clin Invest. 2011 Jun;121(6):2118-25.Rorsman P, Renström E. Insulin granule dynamics in pancreatic beta cells. Diabetologia. 2003;46(8):1029–1045.
36th Annual General Meeting and Scientific Conference of the Endocrine and Metabolism Society of Nigeria, Benin City, 2014
Slide13Thank you for listening36th Annual General Meeting and Scientific Conference of the Endocrine and Metabolism Society of Nigeria, Benin City, 2014
Conference presentation
by
Sheu. K. RAHAMON
is licensed under a
Creative Commons Attribution-
NonCommercial
-
ShareAlike
4.0 International License