
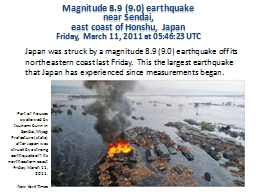
near Sendai east coast of Honshu Japan Friday March 11 2011 at 054623 UTC Japan was struck by a magnitude 89 90 earthquake off its northeastern coast last Friday This the largest ID: 1022865
Download Presentation The PPT/PDF document "Magnitude 8.9 (9.0) earthquake" is the property of its rightful owner. Permission is granted to download and print the materials on this web site for personal, non-commercial use only, and to display it on your personal computer provided you do not modify the materials and that you retain all copyright notices contained in the materials. By downloading content from our website, you accept the terms of this agreement.


1. Magnitude 8.9 (9.0) earthquake near Sendai, east coast of Honshu, JapanFriday, March 11, 2011 at 05:46:23 UTC Japan was struck by a magnitude 8.9 (9.0) earthquake off its northeastern coast last Friday. This the largest earthquake that Japan has experienced since measurements began. Part of houses swallowed by tsunami burn in Sendai, Miyagi Prefecture (state) after Japan was struck by a strong earthquake off its northeastern coast Friday, March 11, 2011. New York Times
2. Chile 1960Alaska 1964Sumatra 2004Chile 2010Japan 2011Russia 1952Ecuador 1906Alaska 1965year1900 1920 1940 1960 1980 2000 20209.69.49.29.08.88.68.48.28.0magnitudeThis is about the 5th largest earthquake since 1900
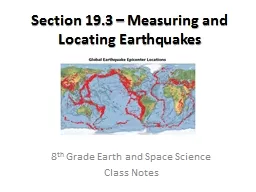
3. Japan is one of the most seismically active areas in the world
4. Japan TrenchUSGSThe event occurred where the Pacific and North American plates converge at a rate of 8.3 cm/year
5. Images courtesy of the US Geological SurveySeismicity Cross Section across the subduction zone showing the relationship between color and earthquake depth.The seismicity of the plate boundary outlines a subduction zone
6. ERI, Univ. Tokyo371 aftershocks, M > 5, in the first two days after the event outline the fault area
7. ERI first motion sense of motion USGS centroid (average) sense of motion10 - 15Looking from the sideLooking from belowThe focal mechanism was a thrust fault
8. The maximum slip was about18 mThe vertical movement of the ocean bottom was up to 2 m and distributed over a 450 km x 150 km faultA slip model ERI, Univ. Tokyo
9. The rupture took about 30 seconds in each point but took 150 seconds to propagate from the focus to other parts of the fault.Moment release rate (dyne cm/s)time (seconds)USGS centroid solutionThe event was complete in 2.5 minutes
10. We model the vertical movement of the ocean bottom due to the event (2 m).The water mass is lifted up by 2 m in 2-3 minutes over an area of 500x150 km and does not have time to flow down the slopes on the sides Initiation of tsunami
11. The initial water bulge expands. The sea level depression on the landward side draws water from the coast.The surface deflection propagates as a gravity surface wave .The wave speed is: H = water depth, g = gravityThe shallower the water, the lower the speed. Therefore, as the tsunami enters shallow waters the wave “piles up”.The non-linear effects of shallow water magnification are difficult to model. Also, complex focussing effects occur in sounds and bays.Initial propagation of tsunami JapanPacific
12. NOAACalculated tsunami timing and maximum amplitude In the deep ocean we can model the timing and amplitude distribution of the tsunami with precision.