
Mountains Experiment OLYMPEX Lynn McMurdie University of Washington coauthors Angela Rowe Joe Zagrodnik Stacy Brodzik Thomas Schuldt Robert Houze and Jamin ID: 1025635
Download Presentation The PPT/PDF document "Terrain-Enhanced Precipitation Processes..." is the property of its rightful owner. Permission is granted to download and print the materials on this web site for personal, non-commercial use only, and to display it on your personal computer provided you do not modify the materials and that you retain all copyright notices contained in the materials. By downloading content from our website, you accept the terms of this agreement.


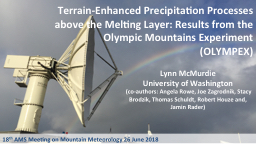
1. Terrain-Enhanced Precipitation Processes above the Melting Layer: Results from the Olympic Mountains Experiment (OLYMPEX)Lynn McMurdie University of Washington (co-authors: Angela Rowe, Joe Zagrodnik, Stacy Brodzik, Thomas Schuldt, Robert Houze and, Jamin Rader)18th AMS Meeting on Mountain Meteorology 26 June 2018
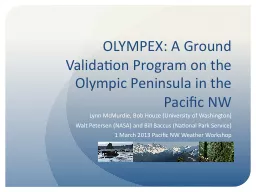
2. OLYMPEX Took place on Olympic PeninsulaFull compliment of radars, aircraft, ground network November 2015 – January 2016Subset of ground network through April 2016Physical validation of precipitation algorithms for the GPM satellitesDocument precipitation processes in winter midlatitude cyclones over complex terrain
3. Prefrontal Environmental CharacteristicsWarm advection (veering winds)StableLow-level SE flowIVT variable (can be high)Increasing Melting Level height
4. Warm Sector Environmental CharacteristicsHigh IVTNeutral StabilitySW flowHigh melting level
5. Postfrontal Environmental CharacteristicsCold AdvectionUnstableW or NW flowLow IVTLow Melting Level
6. Precipitation distribution is used to describe modification by flow over mountainsSeasonal Precipitation Map on windward slopes during OLYMPEXMap of precipitation does not tell whole storyWhat are the processes that create this distribution precipitation?How are processes above the melting layer modified?How does the modification vary with environmental conditions?
7. NPOL S-bandOcean SectorLand SectorX-band SectorCanadian X-bandUse radar reflectivity to document upper-level enhancementVariability of enhancement due to different environmental conditions
8. Orographic Enhancement Aloft from RadarOceanLand – Windward SlopesReflectivity (dBZ)Reflectivity (dBZ)Contoured Frequency by Altitude DiagramsFrequencies normalized by level for all NPOL RHI data over ocean and land above 2 km height
9. Orographic Enhancement Aloft from RadarLand – Ocean Difference CFADGreater frequency of higher reflectivities at all levels over windward slopes. Maximum at 4-5 km range.Shift to higher reflectivity near melting level (2-3 km during warm events)
10. ~Post frontal~Warm sector~Pre-frontal
11. ~Post frontal~Warm sector~Pre-frontalLand - OceanHeight km
12. Warm Sector – 13 November 2015 – IVT high, melting level high, neutral, SW windskmCome see poster #7
13. StableUnstableNeutralPrecipitation particles cannot get across high terrain, blocking?Some diminishment of precipitation but some gets acrossPost-frontal: winds W, NW, not leesideCFAD Difference betweenNPOL Ocean sector and EC X-band Leeside
14. Terrain-Enhanced Precipitation Processes above the Melting LayerEnhancement of the precipitating cloud system occurs aloftSynoptic and environmental conditions affect the degree of enhancement Enhancement on windward slopes greatest during warm, strongly forced eventsThings I couldn’t showThis same pattern of enhancement seen by the DPR on the GPM satelliteWarm rain processes below bright band also important during atmospheric river like conditionsCome see poster #7!!!!!!!
15. AcknowledgementsWork Supported by:NASA grants: NNX16AD75G, NNX16AK05G, 80NSSC17K0279NSF grants: AGS-1503155, AGS-1657251AMS 18th Mountain Meteorology Conference Santa Fe, 26 June 2018