
MSelected Social Characteristics in the United StatesEstimateMargin of ErrorPercentMargin of ErrorFERTILITYNumber of women 15 to 50 years old who had a birth in the past 12 months1080577210805XUnmar ID: 885073
Download Pdf The PPT/PDF document "Charlotte city North CarolinaSelected So..." is the property of its rightful owner. Permission is granted to download and print the materials on this web site for personal, non-commercial use only, and to display it on your personal computer provided you do not modify the materials and that you retain all copyright notices contained in the materials. By downloading content from our website, you accept the terms of this agreement.


1 Charlotte city, North CarolinaSelected S
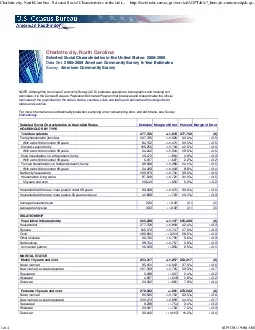
Charlotte city, North CarolinaSelected Social Characteristics in the United States: 2005-2009Data Set: 2005-2009 American Community Survey 5-Year EstimatesSurvey: American Community SurveyNOTE. Although the American Community Survey (ACS) produces population, demographic and housing unit M Selected Social Characteristics in the United StatesEstimateMargin of ErrorPercentMargin of ErrorFERTILITYNumber of women 15 to 50 years old who had a birth in the past 12 months10,805+/-77210,805(X)Unmarried women (widowed, divorced, and never married)3,529+/-50132.7%+/-3.5Per 1,000 unmarried women35+/-5(X)(X)Per 1,000 women 15 to 50 years old57+/-4(X)(X)Per 1,000 women 15 to 19 years old45+/-11(X)(X)Per 1,000 women 20 to 34 years old88+/-8(X)(X)Per 1,000 women 35 to 50 years old30+/-4(X)(X)GRANDPARENTSNumber of grandparents living with own grandchildren under 18 years11,818+/-98311,818(X)Responsible for grandchildren5,381+/-55145.5%+/-3.8Years responsible for grandchildrenLess than 1 year1,002+/-2858.5%+/-2.41 or 2 years1,610+/-34613.6%+/-2.93 or 4 years735+/-2626.2%+/-2.15 or more years2,034+/-37617.2%+/-3.1Number of grandparents responsible for own grandchildren under 18 years5,381+/-5515,381(X)Who are female3,781+/-39070.3%+/-3.8Who are married3,338+/-49862.0%+/-5.3SCHOOL ENROLLMENTPopulation 3 years and over enrolled in school181,439+/-2,142181,439(X)Nursery school, preschool14,871+/-9298.2%+/-0.5Kindergarten10,877+/-7676.0%+/-0.4Elementary school (grades 1-8)71,340+/-1,25739.3%+/-0.7High school (grades 9-12)34,434+/-74919.0%+/-0.5College or graduate school49,917+/-1,63827.5%+/-0.7EDUCATIONAL ATTAINMENTPopulation 25 years and over432,508+/-1,313432,508(X)Less than 9th grade20,094+/-1,4084.6%+/-0.39th to 12th grade, no diploma31,524+/-1,5387.3%+/-0.4High school graduate (includes equivalency)89,325+/-2,26320.7%+/-0.5Some college, no degree86,428+/-2,15820.0%+/-0.5Associate's degree32,897+/-1,4207.6%+/-0.3Bachelor's degree117,421+/-2,50427.1%+/-0.6Graduate or professional degree54,819+/-1,64712.7%+/-0.4Percent high school graduate or higher88.1%+/-0.4(X)(X)Percent bachelor's degree or higher39.8%+/-0.6(X)(X)VETERAN STATUSCivilian population 18 years and over497,290+/-1,104497,290(X)Civilian veterans42,745+/-1,4238.6%+/-0.3DISABILITY STATUS OF THE CIVILIAN NONINSTITUTIONALIZED POPULATIONTotal Civilian Noninstitutionalized Population(X)(X)(X)(X)With a disability(X)(X)(X)(X)Under 18 years(X)(X)(X)(X)With a disability(X)(X)(X)(X)18 to 64 years(X)(X)(X)(X)With a disability(X)(X)(X)(X)65 years and over(X)(X)(X)(X)With a disability(X)(X)(X)(X)RESIDENCE 1 YEAR AGOPopulation 1 year and over658,218+/-837658,218(X)Same house502,807+/-4,43676.4%+/-0.7Different house in the U.S.149,4
2 06+/-4,35922.7%+/-0.7Same county93,862+/
06+/-4,35922.7%+/-0.7Same county93,862+/-3,47914.3%+/-0.5Charlotte city, North Carolina - Selected Social Characteristics in the Unit...http://factfinder.census.gov/servlet/ADPTable?_bm=y&-context=adp&-qr...2 of 46/29/2011 9:06 A M Selected Social Characteristics in the United StatesEstimateMargin of ErrorPercentMargin of ErrorDifferent county55,544+/-2,6418.4%+/-0.4Same state18,347+/-1,8192.8%+/-0.3Different state37,197+/-2,2785.7%+/-0.3Abroad6,005+/-1,0360.9%+/-0.2PLACE OF BIRTHTotal population669,064+/-120669,064(X)Native578,109+/-2,19986.4%+/-0.3Born in United States571,427+/-2,20885.4%+/-0.3State of residence287,850+/-3,68743.0%+/-0.5Different state283,577+/-3,50542.4%+/-0.5Born in Puerto Rico, U.S. Island areas, or born abroad to American parent(s)6,682+/-7051.0%+/-0.1Foreign born90,955+/-2,18313.6%+/-0.3U.S. CITIZENSHIP STATUSForeign-born population90,955+/-2,18390,955(X)Naturalized U.S. citizen24,867+/-1,24327.3%+/-1.5Not a U.S. citizen66,088+/-2,51872.7%+/-1.5YEAR OF ENTRYPopulation born outside the United States97,637+/-2,19297,637(X)Native6,682+/-7056,682(X)Entered 2000 or later1,127+/-35316.9%+/-4.6Entered before 20005,555+/-59383.1%+/-4.6Foreign born90,955+/-2,18390,955(X)Entered 2000 or later39,737+/-2,31743.7%+/-1.9Entered before 200051,218+/-1,54356.3%+/-1.9WORLD REGION OF BIRTH OF FOREIGN BORNForeign-born population, excluding population born at sea90,955+/-2,18390,955(X)Europe10,189+/-98211.2%+/-1.0Asia23,665+/-1,02026.0%+/-1.1Africa8,825+/-1,1899.7%+/-1.2Oceania90+/-600.1%+/-0.1Latin America46,169+/-1,50450.8%+/-1.4Northern America2,017+/-4412.2%+/-0.5LANGUAGE SPOKEN AT HOMEPopulation 5 years and over614,064+/-775614,064(X)English only508,186+/-2,67882.8%+/-0.4Language other than English105,878+/-2,51217.2%+/-0.4Speak English less than "very well"53,492+/-1,8928.7%+/-0.3Spanish59,777+/-1,5209.7%+/-0.2Speak English less than "very well"35,715+/-1,4885.8%+/-0.2Other Indo-European languages22,067+/-1,7933.6%+/-0.3Speak English less than "very well"7,107+/-9531.2%+/-0.2Asian and Pacific Islander languages17,186+/-1,0402.8%+/-0.2Speak English less than "very well"8,639+/-7561.4%+/-0.1Other languages6,848+/-1,0241.1%+/-0.2Speak English less than "very well"2,031+/-6110.3%+/-0.1ANCESTRYTotal population669,064+/-120669,064(X)American30,566+/-1,6434.6%+/-0.2Arab4,534+/-1,0020.7%+/-0.1Czech1,723+/-3300.3%+/-0.1Danish1,415+/-2870.2%+/-0.1Dutch7,828+/-7901.2%+/-0.1English59,970+/-1,9909.0%+/-0.3French (except Basque)12,947+/-1,0281.9%+/-0.2French Canadian2,661+/-4390.4%+/-0.1German72,566+/-2,14910.8%+/-0.3Greek4,429+/-6660.7%+/-0.1Hungarian2,109+/-4230.3%+/-0.1Charlotte city, North Carolina - Selected Social Characteristics in the Unit...http://factfind
3 er.census.gov/servlet/ADPTable?_bm=y&-co
er.census.gov/servlet/ADPTable?_bm=y&-context=adp&-qr...3 of 46/29/2011 9:06 A M Selected Social Characteristics in the United StatesEstimateMargin of ErrorPercentMargin of ErrorIrish56,929+/-2,1768.5%+/-0.3Italian29,041+/-1,8464.3%+/-0.3Lithuanian923+/-2870.1%+/-0.1Norwegian3,359+/-4650.5%+/-0.1Polish12,249+/-1,0521.8%+/-0.2Portuguese1,127+/-3970.2%+/-0.1Russian5,940+/-9360.9%+/-0.1Scotch-Irish26,890+/-1,5704.0%+/-0.2Scottish17,267+/-1,1792.6%+/-0.2Slovak1,288+/-2890.2%+/-0.1Subsaharan African11,562+/-1,2991.7%+/-0.2Swedish4,079+/-5310.6%+/-0.1Swiss1,711+/-3690.3%+/-0.1Ukrainian2,273+/-6630.3%+/-0.1Welsh4,074+/-6430.6%+/-0.1West Indian (excluding Hispanic origin groups)3,712+/-8170.6%+/-0.1Source: U.S. Census Bureau, 2005-2009 American Community SurveyData are based on a sample and are subject to sampling variability. The degree of uncertainty for an estimate arising from sampling variability is representedthrough the use of a margin of error. The value shown here is the 90 percent margin of error. The margin of error can be interpreted roughly as providing a 90percent probability that the interval defined by the estimate minus the margin of error and the estimate plus the margin of error (the lower and upper confidencebounds) contains the true value. In addition to sampling variability, the ACS estimates are subject to nonsampling error (for a discussion of nonsamplingvariability, see Accuracy of the Data). The effect of nonsampling error is not represented in these tables.Notes:·Ancestry listed in this table refers to the total number of people who responded with a particular ancestry; for example, the estimate given for Russianrepresents the number of people who listed Russian as either their first or second ancestry. This table lists only the largest ancestry groups; see the DetailedTables for more categories. Race and Hispanic origin groups are not included in this table because official data for those groups come from the Race andHispanic origin questions rather than the ancestry question (see Demographic Table).·The Census Bureau introduced a new set of disability questions in the 2008 ACS questionnaire. Because of contextual differences between the 2008-2009disability data and disability data collected in prior years, the Census Bureau is unable to combine the 5 years of disability data in order to produce themulti-year estimate that would appear in this table. Multi-year estimates of disability status will become available once five consecutive years of data arecollected. For more information about the differences between the 2008 and prior years' disability questions, see Review of Changes to the Measurement ofDisability in the 2008 ACS·Data for yea
4 r of entry of the native population refl
r of entry of the native population reflect the year of entry into the U.S. by people who were born in Puerto Rico, U.S. Island Areas or born outsidethe U.S. to a U.S. citizen parent and who subsequently moved to the U.S.·While the 2005-2009 American Community Survey (ACS) data generally reflect the November 2008 Office of Management and Budget (OMB) definitions ofmetropolitan and micropolitan statistical areas; in certain instances the names, codes, and boundaries of the principal cities shown in ACS tables may differfrom the OMB definitions due to differences in the effective dates of the geographic entities.·Estimates of urban and rural population, housing units, and characteristics reflect boundaries of urban areas defined based on Census 2000 data. Boundariesfor urban areas have not been updated since Census 2000. As a result, data for urban and rural areas from the ACS do not necessarily reflect the results ofongoing urbanization.Explanation of Symbols:1. An '**' entry in the margin of error column indicates that either no sample observations or too few sample observations were available to compute a standarderror and thus the margin of error. A statistical test is not appropriate.2. An '-' entry in the estimate column indicates that either no sample observations or too few sample observations were available to compute an estimate, or aratio of medians cannot be calculated because one or both of the median estimates falls in the lowest interval or upper interval of an open-ended distribution.3. An '-' following a median estimate means the median falls in the lowest interval of an open-ended distribution.4. An '+' following a median estimate means the median falls in the upper interval of an open-ended distribution.5. An '***' entry in the margin of error column indicates that the median falls in the lowest interval or upper interval of an open-ended distribution. A statistical testis not appropriate.6. An '*****' entry in the margin of error column indicates that the estimate is controlled. A statistical test for sampling variability is not appropriate.7. An 'N' entry in the estimate and margin of error columns indicates that data for this geographic area cannot be displayed because the number of samplecases is too small.8. An '(X)' means that the estimate is not applicable or not available.The letters PDF or symbol indicate a document is in the Portable Document Format (PDF). To view the file you will needthe Adobe® Acrobat® Reader, which is available for free from the Adobe web site.Charlotte city, North Carolina - Selected Social Characteristics in the Unit...http://factfinder.census.gov/servlet/ADPTable?_bm=y&-context=adp&-qr...4 of 46/29/2011 9:06