
Key Terms Atmosphere a thin envelope of gases that encircles the earth and other particles aerosols Weather the state of the atmosphere at a specific place and time Meteorology the study of the atmosphere and the processes that cause weather ID: 132810
Download Presentation The PPT/PDF document "Chapter 2: Atmosphere: Origin, Compositi..." is the property of its rightful owner. Permission is granted to download and print the materials on this web site for personal, non-commercial use only, and to display it on your personal computer provided you do not modify the materials and that you retain all copyright notices contained in the materials. By downloading content from our website, you accept the terms of this agreement.


Slide1
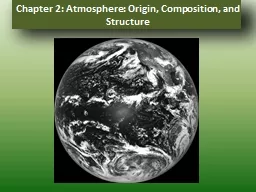
Chapter 2: Atmosphere: Origin, Composition, and StructureSlide2
Key Terms
Atmosphere
– a thin envelope of gases that encircles the earth and other particles (aerosols)
Weather
– the state of the atmosphere at a specific place and time
Meteorology
– the study of the atmosphere and the processes that cause weather
Climate
– weather conditions at some place averaged over a specific time period
Climatology
– the study of the climateSlide3
Computer Forecast Models
Scientific Model
– an approximate representation of a real system (Earth-Atmosphere System)
Conceptual
Graphical – weather map
PhysicalNumerical – run by computers (used to predict weather)All models simulate reality and are subject to error. More at: http://www.crh.noaa.gov/news/display_cmsstory.php?wfo=lmk&storyid=106486&source=0Slide4
Modern Atmosphere
Homosphere
– lowest 80km of the atmosphere where principal gas ratios remain relatively constant
Heterosphere
– above 80km where concentrations of heavier gases decrease more rapidlySlide5
Important Gases
Nitrogen (N
2
)
~ 78%
Oxygen (O2) ~ 21%Argon (Ar) ~ 1%Greenhouse Gases – trace amounts but important role on EarthWater Vapor (H2
O) ~ 0-4%
Carbon Dioxide (CO
2
)
Ozone (O
3)Methane (CH4)Slide6
Aerosols
Tiny solid and liquid particles suspended in the atmosphere
Wind erosion of soil
Ocean spray
Forest fires
Volcanic eruptionsAgricultural and industrial activitiesSlide7
Pollution
Air Pollutant
– gas or aerosol that at a certain concentration adversely affects organisms and the environment
Natural pollutant: carbon monoxide
Non-natural pollutant: benzene Primary – harmful immediately upon emission into atmosphere (car exhaust)Secondary – results of chemical reactions between primary pollutants (smog)Slide8
Monitoring the Atmosphere
Surface Observations
First done in 1800’s by Army Medical Corps - now run by the National Weather Service (NWS)
Automated Surface Observing System (ASOS)
About 1700 across the US
Fully automated year roundNWS Cooperative Observer NetworkAbout 8000 across the USMonitored by volunteers with equipment supplied by NWSDoppler RadarAbout 113 operated by the NWS
Others operated by television stations, military, private companiesSlide9
Monitoring the Atmosphere
Surface observations, continued
Army monitored weather to compare with troop health
Mid-1800s – national network of volunteer observers
1849 – telegraph companies transmitted weather conditions free of charge
1860s – loss of ships in Great LakesGovernment took a greater role in forecasting1870 – President Ulysses S. Grant established 24 stations under the auspices of the U.S. Army Signal Corps1891 – transferred from military to civilian handsNew weather bureau under U.S. Department of AgricultureSlide10
Monitoring the Atmosphere
Surface observations, continued
Transferred to Commerce Department in 1940
1965, Weather Bureau reorganized into the National Weather Service (NWS)
Under Environmental Science Services Administration (ESSA), which became National Oceanic and Atmospheric Administration (NOAA)
1990s – NWS modernized and expandedToday,123 NWS Forecast Offices (see next slide)Added Automated Surface Observing Systems (ASOS)Slide11
NWS Forecast OfficesSlide12
Monitoring the Atmosphere
Automated Surface Observing System (ASOS)
Cooperative Observer Network
Member stations record daily precipitation and max/min temperatures for hydrologic, agricultural, and climatic purposesSlide13
Monitoring the Atmosphere
Upper Air Observations
Radiosonde – measuring device carried through the atmosphere by a weather balloon
Transmit data immediately
Balloons are launched simultaneously at 0000 and 1200 UTC
Data transmitted (temperature, pressure, dewpoint, wind) are plotted on a chart creating a soundingDropwindsonde – same thing except dropped by an airplane instead of launched by a balloonSatellitesSlide14
Monitoring the Atmosphere
Radiosonde
Launching
a R
adiosondeSlide15
Upper Air Observations
Locations of radiosonde observation stations
Data from radiosonde shown in a
St
ü
ve
diagramSlide16
Remote Sensing
Measurement of environmental conditions by processing signals that are either emitted by an object or reflected back to a signal source
Radar
SatellitesSlide17
Atmospheric Setup
The atmosphere is divided into several different concentric layers. This plot shows the variation in average air temperature with height.Slide18
Characteristics of Air Masses & Fronts
Pressure decreases exponentially with height. This means that the majority of the molecules that make up the atmosphere are in the lower layers. About 50% of the atmosphere's mass is within 6km of the surface and 99.9% is within 50km. Slide19
Layers of the Atmosphere
Troposphere
Layer at the surface
Layer where weather occurs (except some high clouds)
About 6km high at the poles and 20km at the equator
Temperature generally decreases with height due to sunlight heating the Earth’s surface and warms air above it.Tropopause – boundary between troposphere and stratosphere (average height near 12km)Tropopause varies in height across the globe
.Slide20
Layers of the Atmosphere
Stratosphere
About 40km thick (extends to an altitude near 50km)
Layer where airplanes fly (location of jet stream)
Layer where ozone is present
Temperature generally increases with height (Ozone absorbing solar radiation followed by a
release of energy, which warms the stratosphere)
Stratopause
– boundary between stratosphere and mesosphere
Why do I want to fly here?
Get to places faster
It’s a fairly stable layer (most weather occurs in the troposphere), less turbulenceSlide21
Layers of the Atmosphere
Mesosphere
Base is about 50km above the surface
Temperature again decreases with height
Coldest layer of the atmosphere (little ozone)
Atmospheric pressure at around 1 mb99% of atmospheric mass located below
Without proper breathing equipment, brain would become oxygen starved
Extends to the
mesopause
which is about 80km (50 miles) above the surface of the earth
Thermosphere
Extremely thin air (particles range from 1-10km apart)Increasing temperature because first particles to receive sun’s energy (solar radiation)
Estimated top is about 500km
May be 10 km between molecules
Heat shield
Exosphere (outer space)Slide22
Ionosphere
Primarily located in the thermosphere
Home to a high concentration of ions and electrons
Location of the Aurora Borealis
Caused by the solar wind, in which Earth’s magnetic field deflectsSlide23
The Ionosphere and the Aurora
The magnetosphere is caused by the deflection of the solar wind by Earth’s magnetic field
Solar wind = Stream of charged particles let go from the upper atmosphere of the sun
Aurora borealisSlide24
Review
Air Temperature and Altitudinal Relationships in the Atmosphere