
efficient are Albemarle EMSFire Responses based on drive time vs response time 2 Which areas experience the most efficient responses 3 Which areas experience the worst response times Possible reasons for both ID: 655889
Download Presentation The PPT/PDF document "Essential Questions 1. How" is the property of its rightful owner. Permission is granted to download and print the materials on this web site for personal, non-commercial use only, and to display it on your personal computer provided you do not modify the materials and that you retain all copyright notices contained in the materials. By downloading content from our website, you accept the terms of this agreement.


Slide1
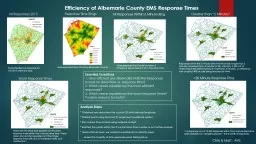
Essential Questions1. How efficient are Albemarle EMS/Fire Responses based on drive time vs. response time?2. Which areas experience the most efficient responses?3. Which areas experience the worst response times?Possible reasons for both?
Efficiency of Albemarle County EMS Response Times
Every Fire/Rescue response for
the 2015 calendar year.
Raw expected drive times for Albemarle County.
Every response that should’ve taken 5
minutes or
less to respond to in raw drive time.
Responses within the 5 minute drive time that took longer than 5 minutes (anywhere from 6 minutes to 25+ minutes). 9,630 out of 18,523 responses were reached in more than 5 minutes, an efficiency rate of about 48% of calls being reached on time.
These are the areas that experience the worst response times within the 5 minute drive time. These areas are heavily populated and the longer response times are due to increased traffic and construction.
Worst Response Times
All Responses 2015
Response Time Rings
All Responses Within 5 Minute
Ring
Greater than “5 Minutes”
>20 Minute Response Time
116 responses out of 18,523 responses within the 5 minute drive time were classified as “dangerously late.” This is 0.01% of responses.
Analysis Steps
* Obtained raw data from the county GIS with latitude/longitude.
* Plotted points using the Nad_27 projected coordinate system.* Ran a drive time analysis using network analyst.* Isolated the points within the 5 minute drive time in order to run further analysis.* Used a fishnet layer, we created a spatial join to identify areas where the majority of late responses were taking place.
Chris & Matt - AHS