

httpwwwusersyorkacukpml1bayescartoonscartoon08jpg 1 Comparison of Named Distributions discrete continuous Bernoulli Binomial Geometric Negative Binomial Poisson Hypergeometric Discrete Uniform ID: 376441
Download Presentation The PPT/PDF document "Part VI: Named Continuous Random Variabl..." is the property of its rightful owner. Permission is granted to download and print the materials on this web site for personal, non-commercial use only, and to display it on your personal computer provided you do not modify the materials and that you retain all copyright notices contained in the materials. By downloading content from our website, you accept the terms of this agreement.


Slide1
Part VI: Named Continuous Random Variables
http://www-users.york.ac.uk/~pml1/bayes/cartoons/cartoon08.jpg
1Slide2
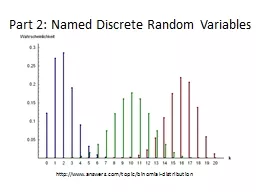
Comparison of Named Distributions
discrete
continuous
Bernoulli,
Binomial, Geometric, Negative Binomial, Poisson, Hypergeometric, Discrete Uniform
Continuous Uniform, Exponential, Gamma, Beta, Normal
2Slide3
Chapter 30: Continuous Uniform R.V.
http://www.six-sigma-material.com/Uniform-Distribution.html
3Slide4
Uniform distribution: Summary
Things to look for: constant density on a line or area
Variable: X = an exact position or arrival timeParameter:
(
a,b): the endpoints where the density is nonzero.Density: CDF:
4Slide5
Example: Uniform Distribution (Class)
A bus arrives punctually at a bus stop every thirty minutes. Each morning, a bus rider leaves her house and casually strolls to the bus stop.
Why is this a Continuous Uniform distribution situation? What are the parameters? What is X?What is the density for the wait time in minutes?
What is the CDF for the wait time in minutes?
Graph the density.
Graph the CDF.What is the expected wait time?5Slide6
Example: Uniform Distribution (Class)
A bus arrives punctually at a bus stop every thirty minutes. Each morning, a bus rider leaves her house and casually strolls to the bus stop.
What is the standard deviation for the wait time?What is the probability that the person will wait between 20 and 40 minutes? (Do this via 3 different methods.)
Given that the person waits at least 15 minutes, what is the probability that the person will wait at least 20 minutes?
6Slide7
Example: Uniform Distribution
7Slide8
Example: Uniform Distribution (Class)
A bus arrives punctually at a bus stop every thirty minutes. Each morning, a bus rider leaves her house and casually strolls to the bus stop.
Let the cost of this waiting be $20 per minute plus an additional $5.What are the parameters?
What is the density for the cost in minutes?
What is the CDF for the cost in minutes?
What is the expected cost to the rider?What is the standard deviation of the cost to the rider?8Slide9
Chapter 31: Exponential R.V.
http://en.wikipedia.org/wiki/Exponential_distribution
9Slide10
Exponential Distribution: Summary
Things to look for: waiting time until first event occurs or time between events.
Variable:
X = time until the next event occurs, X ≥ 0
Parameter:
: the average rateDensity: CDF:
10Slide11
Example: Exponential R.V. (class)
Suppose that the arrival time (on average) of a large earthquake in Tokyo occurs with an exponential distribution with an average of 8.25 years.
What does X represent in this story? What values can X take?Why is this an example of the Exponential distribution?
What is the parameter for this distribution?
What is the density?
What is the CDF?What is the standard deviation for the next earthquake?11Slide12
Example: Exponential R.V. (class, cont.)
Suppose that the arrival time (on average) of a large earthquake in Tokyo occurs with an exponential distribution with an average of 8.25 years.
What is the probability that the next earthquake occurs after three but before eight years?What is the probability that the next earthquake occurs before 15 years
?
What is the probability that the next earthquake occurs after 10 years
?How long would you have to wait until there is a 95% chance that the next earthquake will happen?12Slide13
Example: Exponential R.V. (Class, cont.)
Suppose that the arrival time (on average) of a large earthquake in Tokyo occurs with an exponential distribution with an average of 8.25 years.
k) Given that there has been no large Earthquakes in Tokyo for more than 5 years, what is the chance that there will be a large Earthquake in Tokyo in more than 15 years? (Do this problem using the memoryless
property and the definition of conditional probabilities.)
13Slide14
Minimum of Two (or More) Exponential Random Variables
Theorem 31.5If X1
, …, Xn are independent exponential random variables with parameters
1
, …,
n then Z = min(X1, …, Xn) is an exponential random variable with parameter 1 + … + n.14Slide15
Chapter 37: Normal R.V.
http://delfe.tumblr.com/
15Slide16
Normal Distribution: Summary
Things to look for: bell curve,
Variable: X = the eventParameters:
X = the meanDensity:
16Slide17
PDF of Normal Distribution (cont)
http://commons.wikimedia.org/wiki/File:Normal_distribution_pdf.svg
17Slide18
PDF of Normal Distribution
http://www.oswego.edu/~srp/stats/z.htm
18Slide19
19Slide20
PDF of Normal Distribution (cont)
http://commons.wikimedia.org/wiki/File:Normal_distribution_pdf.svg
20Slide21
Procedure for doing Normal Calculations
Sketch the problem.
Write down the probability of interest in terms of the original problem.Convert to standard normal.
Convert to CDFs.
Use the z-table to write down the values of the CDFs.
Calculate the answer.21Slide22
Example: Normal r.v. (Class)
The gestation periods of women are normally distributed with
= 266 days and = 16 days. Determine the probability that a gestation period is
l
ess than 225 days.
between 265 and 295 days.more than 276 days.less than 300 days.Among women with a longer than average gestation, what is the probability that they give birth longer than 300 days?22Slide23
Example: “Backwards” Normal r.v. (Class)
The gestation periods of women are normally distributed with
= 266 days and = 16 days. Find the gestation length for the following situations:
longest
6%.
shortest 13%.middle 50%.23Slide24
Example: Normal r.v. (class)
Suppose that a Scottish soldier's chest size is normally distributed with
= 39.8 inches and = 2.05 inches. a) What is the probability that a Scottish soldier has a chest size of less than 35 inches?
b
) What is the probability that a Scottish soldier has a chest of at least 40 inches?
c) What is the probability that a Scottish soldier has a chest size between 35 and 40 inches?24Slide25
Chapter 35: Sums of Independent Normal Random Variables
https://www.statsoft.com/Textbook/Cluster-Analysis
25Slide26
Chapter 36: Central Limit Theorem(Normal Approximations to Discrete Distributions – 36.4, 36.5)
http://nestor.coventry.ac.uk/~nhunt/binomial/normal.html
http://nestor.coventry.ac.uk/~
nhunt/poisson
/
normal.html26Slide27
Continuity Correction - 1
http://www.marin.edu/~npsomas/Normal_Binomial.htm
27Slide28
Continuity Correction - 2
X
~ Binomial(20, 0.5)
W~
N
(10, 5)28Slide29
Continuity Correction - 3
Discrete
Continuous
a < X
a
+ 0.5 < Xa ≤ Xa – 0.5 < X X < b X < b – 0.5 X ≤ b X < b + 0.529Slide30
Normal Approximation to Binomial
30Slide31
Example: Normal Approximation to Binomial (Class)
The ideal size of a first-year class at a particular college is 150 students. The college, knowing from past experience that on the average only 30 percent of these accepted for admission will actually attend, uses a policy of approving the applications of 450 students.
Compute the probability that more than 150 students attend this college.Compute the probability that fewer than 130 students attend this college.
31Slide32
Chapter 32: Gamma R.V.
http://
resources.esri.com/help/9.3/arcgisdesktop/com/gp_toolref
/process_simulations_sensitivity_analysis_and_error_analysis_modeling
/
distributions_for_assigning_random_values.htm32Slide33
Gamma Distribution
Generalization of the exponential functionUsesprobability theorytheoretical statistics
actuarial scienceoperations researchengineering
33Slide34
Gamma Function
(t + 1) = t (t), t > 0, t real
(n + 1) = n!, n > 0, n integer
34Slide35
Gamma Distribution: Summary
Things to look for: waiting time until
rth event occurs
Variable: X = time until the
rth
event occurs, X ≥ 0Parameters: r: total number of arrivals/events that you are waiting for : the average rateDensity:
35Slide36
Gamma Random Variable
http://en.wikipedia.org/wiki/File:Gamma_distribution_pdf.svg
k = r
36Slide37
Chapter 33: Beta R.V.
http://mathworld.wolfram.com/BetaDistribution.html
37Slide38
Beta Distribution
This distribution is only defined on an intervalstandard beta is on the interval [0,1]The formula in the book is for the standard beta
usesmodeling proportionspercentagesprobabilities
38Slide39
Beta Distribution: Summary
Things to look for: percentage, proportion, probability
Variable: X = percentage, proportion, probability of interest (standard Beta)
Parameters:
, Density:
Density: no simple form
When A = 0, B = 1 (Standard Beta)
39Slide40
Shapes of Beta Distribution
http://upload.wikimedia.org/wikipedia/commons/9/9a/Beta_distribution_pdf.png
X
40Slide41
Other Continuous Random Variables
Weibullexponential is a member of family
uses: lifetimeslognormallog of the normal distributionuses: products of distributions
Cauchy
symmetrical, flatter than normal
41Slide42
Chapter 37: Summary and Review of Named Continuous R.V.
http://
www.wolfram.com/mathematica/new-in-8/parametric-probability-distributions
/
univariate-continuous-distributions.html
42Slide43
Summary of Continuous Distributions
Name
Density,
f
X
(x)DomainCDF, FX(x)(X)Var(X)ParametersWhat X isWhen used
Name
Density,
f
X
(x)
Domain
CDF, FX(x)Var(X)ParametersWhat X isWhen used43Slide44
Expected values and Variances for selected families of continuous random variables.
Family
Parameter(s)
Expectation
Variance
Uniforma,bExponentiallNormalm,s2m2
44