
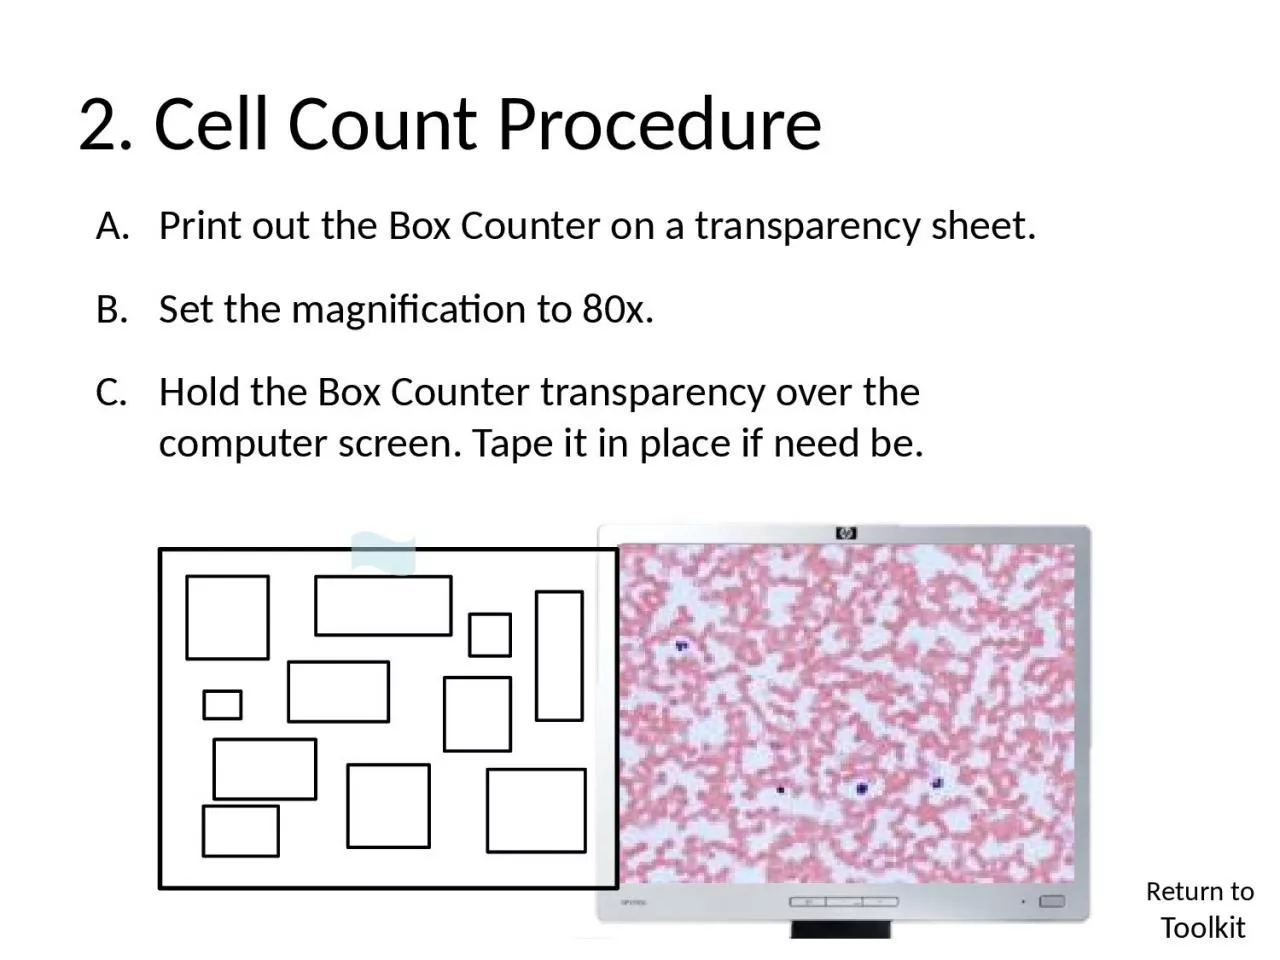
Print out the Box Counter on a transparency sheet Set the magnification to 80x Hold the Box Counter transparency over the computer screen Tape it in place if need be Return to Toolkit 2 ID: 1007219
Download Presentation The PPT/PDF document "2 . Cell Count Procedure" is the property of its rightful owner. Permission is granted to download and print the materials on this web site for personal, non-commercial use only, and to display it on your personal computer provided you do not modify the materials and that you retain all copyright notices contained in the materials. By downloading content from our website, you accept the terms of this agreement.


1. 2. Cell Count ProcedurePrint out the Box Counter on a transparency sheet. Set the magnification to 80x. Hold the Box Counter transparency over the computer screen. Tape it in place if need be. Return to Toolkit
2. 2. Cell Count ProcedurePrint out the Box Counter on a transparency sheet. Set the magnification to 80x. Hold the Box Counter transparency over the computer screen. Tape it in place if need be. Students will do a separate count for red blood cells and white blood cells. Count the number of cells inside each box, including ones touching the boxes borders. Record the numbers in the worksheet and add up totals. Move to a new area and repeat two or more times. Print out the Box Counter on a transparency sheet. Set the magnification to 80x. Hold the Box Counter transparency over the computer screen. Tape it in place if need be. Students will do a separate count for red blood cells and white blood cells. Count the number of cells inside each box, including ones touching the boxes borders to provide a random sampling that represents the whole. Record the numbers in the worksheet and add up totals. Note: stacked overlapped red blood cells Regarding stacked overlapped blood cells in the abnormal blood sample, the best we can do is to count the curved lines (edges of cells) in a stacked group and an estimate here is required.
3. Normal blood127 RBC vs 1 WBCAbnormal blood72 RBC vs 14 WBC
4. 2. Cell Count - Example DataHealthy BloodUnhealthy BloodRBC RBC WBC WBC 2815252330…...4001001…...18155148…...6107645…...5Total Cells Counted633223762Ratio of cellsMagnitude of difference2/ 633 = .00362/237 = .262.262/ .003 = 83 times Conclusion : white blood cells are 83 times more concentrated in the abnormal blood.