
Jamal Alsakran Kent State University Ohio Ye Zhao Kent State University Ohio Yang Chen University of North Carolina ID: 1031300
Download Presentation The PPT/PDF document "STREAMIT: Dynamic Visualization and Inte..." is the property of its rightful owner. Permission is granted to download and print the materials on this web site for personal, non-commercial use only, and to display it on your personal computer provided you do not modify the materials and that you retain all copyright notices contained in the materials. By downloading content from our website, you accept the terms of this agreement.


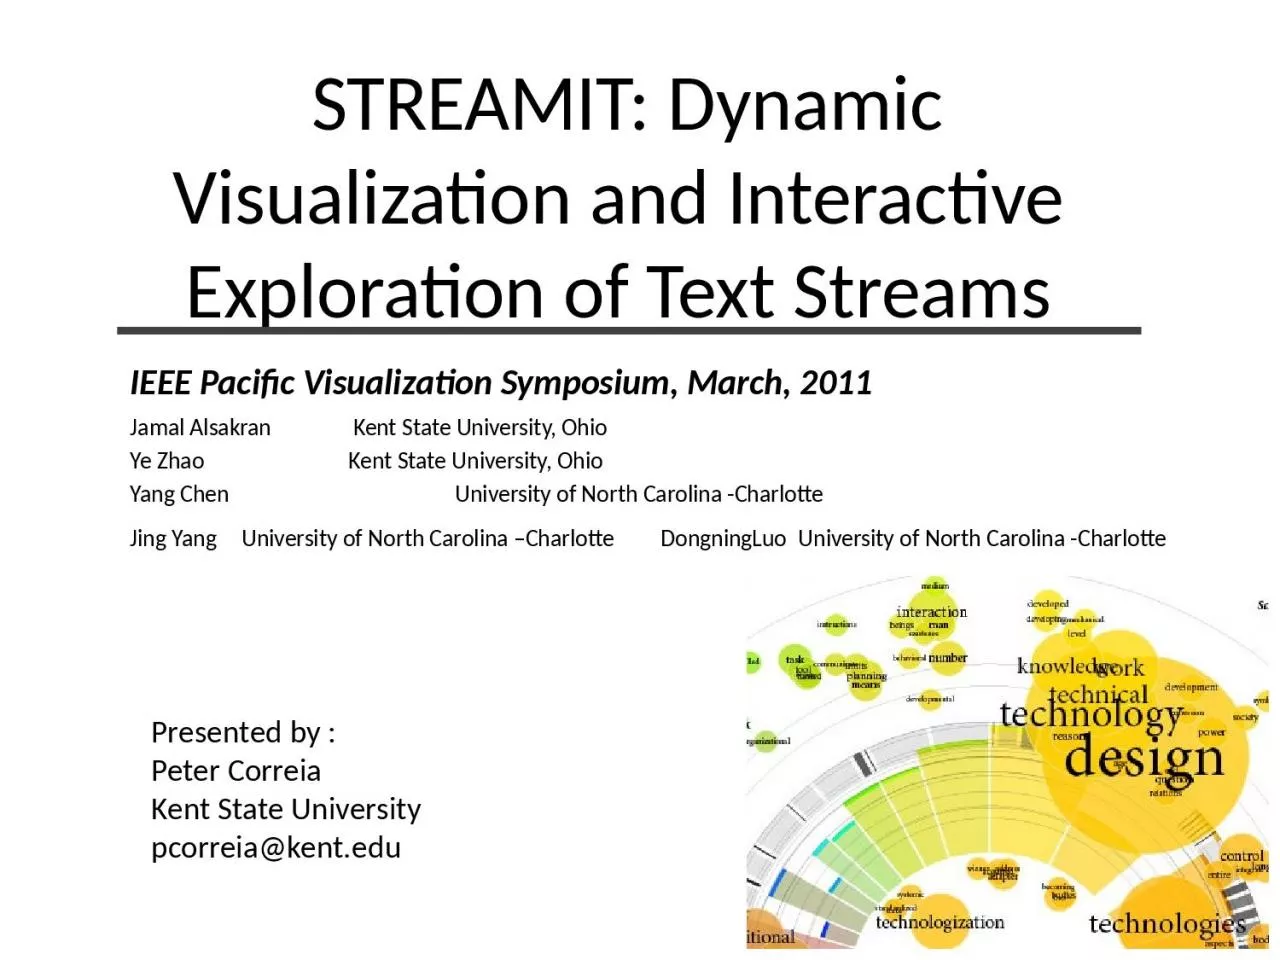
1. STREAMIT: Dynamic Visualization and Interactive Exploration of Text StreamsJamal Alsakran Kent State University, OhioYe Zhao Kent State University, Ohio Yang Chen University of North Carolina -Charlotte Jing Yang University of North Carolina –Charlotte DongningLuo University of North Carolina -Charlotte 1IEEE Pacific Visualization Symposium, March, 2011Presented by :Peter CorreiaKent State Universitypcorreia@kent.edu
2. OutlineIntroduction - Need - Challenges SREAMIT System -System Overview -Force-Based Dynamic System -Dynamic Keyword Importance -Visualization And InteractionCase StudiesPerformance OptimizationConclusionReferences2http://www.visualcomplexity.com/vc/project_details.cfm?id=303&index=40&domain=Knowledge%20Networks
3. NeedExplore huge data setAdapt data of dynamic and increasing natureNeed for efficient processing and analysisTopics not known in advance3???
4. ChallengesTemporal evolutionReal time processing required No priori knowledge of dataProviding user interaction for adjusting or changing 4
5. OutlineIntroduction -Need -Challenges SREAMIT System - System Overview - Force-Based Dynamic System - Dynamic Keyword Importance - Visualization And InteractionCase StudiesPerformance OptimizationConclusion References5
6. SREAMIT SystemContinual evolvementDynamic processingInteractive explorationScalable optimizationDynamic visualization and animationInteraction6
7. SREAMIT System7
8. System Overview8
9. Force-Based Dynamic System9Potential energy between pairs of document particles:Ideal distance computed from document similarity : Cosine similarity ->Similar documents -> smaller ideal distance -> move documents closer to form clusters
10. Dynamic Keyword Importance10http://1.bp.blogspot.com/-h3A-2loNOlc/TaVLolzEdvI/AAAAAAAAAO0/QZ_vPq9PeJw/s1600/Ignorance_vs_Knowledge_by_casperium.jpgImportance freely modified by users at any time: - According to interest/preference - According to discovered knowledge from prior period -Tool to manipulate layout and analyze data
11. Visualization and Interaction11
12. User InteractionAdjusting Keyword ImportanceBrowsing and Tracking KeywordsSelectionIntegrated shoebox for details12
13. OutlineIntroduction -Need -Challenges SREAMIT System -System Overview -Force-Based Dynamic System -Dynamic Keyword Importance -Visualization And InteractionCase StudiesPerformance OptimizationConclusionReferences13
14. Case Study: New York Times NewsTotal article number: 230 Time period Jul. 19 and Sep. 18, 2010About Barack ObamaArticles continuously injected, new keywords added to the keyword table, and their frequencies are updated on-the-flyKeyword importance automatically assigned14
15. Case Study: New York Times News136 news articles High frequency keywords:“Politics and Government”, “International Relations”, “Terrorism”15
16. Case Study: New York Times News16Increase the importance of “International Relations”.Highlight the group with “Afghanistan War” in pink halo (2)“Terrorism” in orange halo (3)
17. OutlineIntroduction -Need -Challenges SREAMIT System -System Overview -Force-Based Dynamic System -Dynamic Keyword Importance -Visualization And InteractionCase StudiesPerformance OptimizationConclusionReferences17
18. Performance Optimization18
19. OutlineIntroduction -Need -Challenges SREAMIT System -System Overview -Force-Based Dynamic System -Dynamic Keyword Importance -Visualization And InteractionCase StudiesPerformance OptimizationConclusionReferences19
20. ConclusionSTREAMIT: An efficient visual exploration system for live text streams -Dynamic physical system -Keyword manipulation with importance -Visual tools20
21. OutlineIntroduction -Need -Challenges SREAMIT System -System Overview -Force-Based Dynamic System -Dynamic Keyword Importance -Visualization And InteractionCase StudiesPerformance OptimizationConclusionReferences21
22. References[1] C. Albrecht-Buehler, B.Watson, and D. Shamma. Visualizing live textstreams using motion and temporal pooling. IEEE Computer Graphicsand Applications, 25(3):52–59, June 2005.[2] K. Andrews, W. Kienreich, V. Sabol, J. Becker, G. Droschl, F. Kappe,M. Granitzer, P. Auer, and K. Tochtermann. The infosky visual explorer:Exploiting hierarchical structure and document similarities.Information Visualization, 1(3):166–181, Dec. 2002.[3] U. Brandes and S. Corman. Visual unrolling of network evolution andthe analysis of dynamic discourse. Information Visualization, 2(1):40–50, 2003.[4] M. Chalmers. A linear iteration time layout algorithm for visualisinghigh-dimensional data. In Proceedings of the 7th conference onVisualization ’96, 1996.[5] Y. Chen, L.Wang,M. Dong, and J. Hua. Exemplar-based visualizationof large document corpus (infovis2009-1115). IEEE Transactions onVisualization and Computer Graphics, 15(6):1161–1168, 2009.[6] Y. Frishman and A. Tal. Online dynamic graph drawing. IEEETransactions on Visualization and Computer Graphics, 14(4):727–740, Aug. 2007.[7] T. Fruchterman and E. Reingold. Graph drawing by force-directedplacement. Software - Practice and Experience, 21(11):1129–1164,Nov. 1991.[8] M. Ghoniem, D. Luo, J. Yang, andW. Ribarsky. Newslab: Exploratorybroadcast news video analysis. In Proceedings of the 2007 IEEE Symposiumon Visual Analytics Science and Technology, pages 123–130,2007.[9] J. Han and M. Kamber. Data mining: concepts and techniques, 2ndEdition. Morgan Kaufmann, San Francisco, CA, USA, 2006.[10] S. Havre, P. Whitney, and L. Nowell. Themeriver: Visualizing thematicchanges in large document collections. IEEE Transactions onVisualization and Computer Graphics, 8:9–20, 2002.[11] E. G. Hetzler, V. L. Crow, D. A. Payne, and A. E. Turner. Turningthe bucket of text into a pipe. In Proceedings of IEEE Symposiumon Information Visualization, page 12, Washington, DC, USA, 2005.IEEE Computer Society.12] Y. Ishikawa and M. Hasegawa. T-scroll: Visualizing trends in a timeseriesof documents for interactive user exploration. Lecture Notes inComputer Science, 4675:235–246, Nov. 2007.22[13] J. Leskovec, L. Backstrom, and J. Kleinberg. Meme-tracking and the dynamics of the news cycle. In Proceedings of the 15th ACMSIGKDD international conference on Knowledge discovery and data mining, pages 497–506, 2009.[14] S. Liu, M. X. Zhou, S. Pan, W. Qian, W. Cai, and X. Lian. Interactive, topic-based visual text summarization and analysis. In Proceeding of the 18th ACM conference on Information and knowledge management, pages 543–552, 2009.[15] D. Luo, J. Yang, M. Krstajic, J. Fan,W. Ribarsky, and D. Keim. Eventriver: An event-based visual analytics approach to exploring large text collections with a temporal focus. In IEEE Transactions on Visualization and Computer Graphics, To appear.[16] H. Luo, J. Fan, Y. Gao, W. Ribarsky, and S. Satoh. Large-scale news video retrieval via visualization. In in ACM Multimedia, pages 783– 784, 2006.[17] A. Morrison, G. Ross, and M. Chalmers. A hybrid layout algorithm for sub-quadratic multidimensional scaling. In Proc. IEEE Symposium on Information Visualization, pages 152–158, 2002. [18] L. Nyland, M. Harris, and J. Prins. Fast n-body simulation with cuda.In GPU Gems 3.[19] F. Paulovich and R. Minghim. Hipp: A novel hierarchical point placement strategy and its application to the exploration of document collections. IEEE Transaction on Visualization and Computer Graphics, 16(8):1229–1236, Nov. 2008.[20] D. C. Rapaport. The Art of Molecular Dynamics Simulation. Cambridge University Press, New York, NY, USA, 1996. [21] G. Salton and C. Buckley. Term-weighting approaches in automatic text retrieval. Information Processing and Management, 24(5):513– 523, 1988.[22] F. B. Viegas, S. Golder, and S. Donath. Visualizing email content: portraying relationships from conversational histories. In Proceedings of the SIGCHI conference on Human Factors in computing systems, pages 543–552, 2006.[23] J. A.Wise, J. J. Thomas, K. Pennock, D. Lantrip, M. Pottier, A. Schur, and V. Crow. Visualizing the non-visual: spatial analysis and interaction with information for text documents. pages 442–450, 1999. [24] P. C. Wong, H. Foote, D. Adams, W. Cowley, and J. Thomas. Dynamic visualization of transient data streams. IEEE Symposium on Information Visualization, 0:13, 2003.[25] J. Yang, D. Luo, and Y. Liu. Newdle: Interactive visual exploration of large online news collections. IEEE Computer Graphics and Applications, 30:32–41, 2010.
23. AcknowledgmentNational Science Foundation IIS-0915528, IIS-0916131 and NSFDACS10P1309.23