
Note Estimated numbers of people refer to people aged 12 or older in the civilian noninstitutionalized population in the United States The numbers do not sum to the total population of the United States because the population for NSDUH does not include people aged 11 years or younger people wit ID: 722869
Download Presentation The PPT/PDF document "Numbers of Past Month Tobacco Users amon..." is the property of its rightful owner. Permission is granted to download and print the materials on this web site for personal, non-commercial use only, and to display it on your personal computer provided you do not modify the materials and that you retain all copyright notices contained in the materials. By downloading content from our website, you accept the terms of this agreement.


Slide1
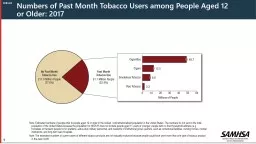
Numbers of Past Month Tobacco Users among People Aged 12 or Older: 2017
Note: Estimated numbers of people refer to people aged 12 or older in the civilian, noninstitutionalized population in the United States. The numbers do not sum to the total population of the United States because the population for NSDUH does not include people aged 11 years or younger, people with no fixed household address (e.g., homeless or transient people not in shelters), active-duty military personnel, and residents of institutional group quarters, such as correctional facilities, nursing homes, mental institutions, and long-term care hospitals.
Note: The estimated numbers of current users of different tobacco products are not mutually exclusive because people could have used more than one type of tobacco product in the past month.
FFR1.01Slide2
Past Month Cigarette Use among People Aged 12 or Older, by Age Group: Percentages, 2002-2017
FFR1.02
Age Group
2002
2003
2004
2005
2006
2007
2008
2009
2010
2011
2012
2013
2014
2015
2016
2017
12 or Older
26.0
+
25.4
+
24.9
+
24.9
+
25.0
+
24.3
+
24.0
+
23.3
+
23.0
+
22.1
+
22.1
+
21.3
+
20.8
+
19.4
+
19.1
+
17.9
12 to 17
13.0
+
12.2
+
11.9
+
10.8
+
10.4
+
9.9
+
9.2
+
9.0
+
8.4
+
7.8
+
6.6
+
5.6
+
4.9
+
4.2
+
3.4
3.2
18 to 25
40.8
+
40.2
+
39.5
+
39.0
+
38.5
+
36.2
+
35.7
+
35.8
+
34.3
+
33.5
+
31.8
+
30.6
+
28.4
+
26.7
+
23.5
22.3
26 or Older
25.2
+
24.7
+
24.1
+
24.3
+
24.7
+
24.1
+
23.8
+
23.0
+
22.8
+
21.9
+
22.4
+
21.6
+
21.5
+
20.0
+
20.2
+
18.9Slide3
Daily Cigarette Use among Past Month Cigarette Smokers Aged 12 or Older and Smoking of One or More Packs of Cigarettes per Day among Current Daily Smokers: 2017
Note: Current daily smokers with unknown data about the number of cigarettes smoked per day were excluded from the pie graph on the right.
FFR1.03Slide4
Smokers of One or More Packs of Cigarettes per Day among Past Month Daily Cigarette Smokers Aged 12 or Older, by Age Group: Percentages, 2002-2017
FFR1.04
* Low precision; no estimate reported.
Age Group
2002
2003
2004
2005
2006
2007
2008
2009
2010
2011
2012
2013201420152016201712 or Older 53.1+ 53.5+ 54.0+ 51.4+ 50.6+ 50.9+ 49.2+ 45.9+ 45.1+ 43.8+ 42.0 41.3 40.3 41.1 41.1 41.212 to 17 21.8 22.0 19.4 20.1 17.9 18.7 18.4 17.9 16.7 14.8 10.8 11.9 11.9 7.8 * *18 to 25 39.1+ 37.1+ 34.9+ 36.9+ 34.4+ 32.9+ 31.6+ 29.5+ 27.3 26.1 25.1 22.3 22.5 22.5 26.2 25.026 or Older 57.1+ 58.0+ 59.2+ 55.1+ 54.5+ 55.1+ 53.0+ 49.4+ 48.8+ 47.4+ 45.2 44.7 43.3 44.1 43.1 43.2Slide5
Current, Binge, and Heavy Alcohol Use among People Aged 12 or Older: 2017
Note: Since 2015, the threshold for determining binge alcohol use for males is consuming five or more drinks on an occasion and for females is consuming four or more drinks on an occasion.
FFR1.05Slide6
Past Month Alcohol Use among People Aged 12 or Older, by Age Group: Percentages, 2002-2017
FFR1.06
Age Group
2002
2003
2004
2005
2006
2007
2008
2009
2010
2011
2012
2013
201420152016201712 or Older 51.0+ 50.1+ 50.3+ 51.8 51.0 51.2 51.6 51.9 51.8 51.8 52.1 52.2 52.7+ 51.7 50.7+ 51.712 to 17 17.6+ 17.7+ 17.6+ 16.5+ 16.7+ 16.0+ 14.7+ 14.8+ 13.6+ 13.3+ 12.9+ 11.6+ 11.5+ 9.6 9.2 9.918 to 25 60.5+ 61.4+ 60.5+ 60.9+ 62.0+ 61.3+ 61.1+ 61.8+ 61.4+ 60.7+ 60.2+ 59.6+ 59.6+ 58.3+ 57.1 56.326 or Older 53.9+ 52.5+ 53.0+ 55.1 53.7+ 54.1+ 54.7 54.9 54.9 55.1 55.6
55.9
56.5
55.6
54.6
+
55.8Slide7
Past Month Binge and Heavy Alcohol Use among People Aged 12 or Older, by Age Group: Percentages, 2017
Note: Since 2015, the threshold for determining binge alcohol use for males is consuming five or more drinks on an occasion and for females is consuming four or more drinks on an occasion.
FFR1.07Slide8
Current, Binge, and Heavy Alcohol Use among People Aged 12 to 20: 2017
Note: Since 2015, the threshold for determining binge alcohol use for males is consuming five or more drinks on an occasion and for females is consuming four or more drinks on an occasion.
FFR1.08Slide9
Current, Binge, and Heavy Alcohol Use among People Aged 12 to 20: Percentages, 2017
Note: Since 2015, the threshold for determining binge alcohol use for males is consuming five or more drinks on an occasion and for females is consuming four or more drinks on an occasion.
FFR1.09Slide10
Current Alcohol Use among People Aged 12 to 20: Percentages, 2002-2017
FFR1.10
Use
2002
2003
2004
2005
2006
2007
2008
2009
2010
2011
2012
2013
2014201520162017Current 28.8+ 29.0+ 28.7+ 28.2+ 28.4+ 28.0+ 26.5+ 27.2+ 26.2+ 25.1+ 24.3+ 22.7+ 22.8+ 20.3 19.3 19.7Slide11
Numbers of Past Month Illicit Drug Users among People Aged 12 or Older: 2017
Note: Estimated numbers of people refer to people aged 12 or older in the civilian, noninstitutionalized population in the United States. The numbers do not sum to the total population of the United States because the population for NSDUH does not include people aged 11 years or younger, people with no fixed household address (e.g., homeless or transient people not in shelters), active-duty military personnel, and residents of institutional group quarters, such as correctional facilities, nursing homes, mental institutions, and long-term care hospitals.
Note: The estimated numbers of current users of different illicit drugs are not mutually exclusive because people could have used or misused more than one type of illicit drug in the past month.FFR1.11Slide12
Past Month Illicit Drug Use among People Aged 12 or Older, by Age Group: 2017
FFR1.12Slide13
Past Month Marijuana Use among People Aged 12 or Older, by Age Group: Percentages, 2002-2017
FFR1.13
Age Group
2002
2003
2004
2005
2006
2007
2008
2009
2010
2011
2012
2013
201420152016201712 or Older 6.2+ 6.2+ 6.1+ 6.0+ 6.0+ 5.8+ 6.1+ 6.7+ 6.9+ 7.0+ 7.3+ 7.5+ 8.4+ 8.3+ 8.9+ 9.612 to 17 8.2+ 7.9+ 7.6+ 6.8 6.7 6.7 6.7 7.4+ 7.4+ 7.9+ 7.2+ 7.1 7.4+ 7.0 6.5 6.518 to 25 17.3+ 17.0+ 16.1+ 16.6+ 16.3+ 16.5+ 16.6+ 18.2+ 18.5+ 19.0+ 18.7+ 19.1+ 19.6+ 19.8+ 20.8+ 22.126 or Older 4.0+ 4.0+ 4.1+ 4.1+ 4.2+ 3.9+
4.2
+
4.6
+
4.8
+
4.8
+
5.3
+
5.6
+
6.6
+
6.5
+
7.2
+
7.9Slide14
Numbers of Past Month Prescription Psychotherapeutic Misusers among People Aged 12 or Older: 2017
Note: Estimated numbers of people refer to people aged 12 or older in the civilian, noninstitutionalized population in the United States. The numbers do not sum to the total population of the United States because the population for NSDUH does not include people aged 11 years or younger, people with no fixed household address (e.g., homeless or transient people not in shelters), active-duty military personnel, and residents of institutional group quarters, such as correctional facilities, nursing homes, mental institutions, and long-term care hospitals.
Note: The estimated numbers of past month misusers of different prescription psychotherapeutics are not mutually exclusive because people could have misused more than one type of prescription psychotherapeutic in the past month.FFR1.14Slide15
Past Month Prescription Psychotherapeutic Misuse among People Aged 12 or Older, by Age Group: Percentages, 2017
FFR1.15Slide16
Past Month Cocaine Use among People Aged 12 or Older, by Age Group: Percentages, 2002-2017
FFR1.16
Age Group
2002
2003
2004
2005
2006
2007
2008
2009
2010
2011
2012
2013
201420152016201712 or Older 0.9 1.0+ 0.8 1.0+ 1.0+ 0.8 0.7 0.7+ 0.6+ 0.5+ 0.6+ 0.6+ 0.6+ 0.7 0.7 0.812 to 17 0.6+ 0.6+ 0.5+ 0.6+ 0.4+ 0.4+ 0.4+ 0.3+ 0.2+ 0.3+ 0.1 0.2 0.2 0.2 0.1 0.118 to 25 2.0 2.2 2.1 2.6+ 2.2 1.7 1.6+ 1.4+ 1.5+ 1.4+ 1.1+ 1.1+ 1.4+ 1.7 1.6 1.926 or Older 0.7 0.8 0.7 0.8 0.8 0.7 0.7 0.6 0.5+ 0.4+ 0.6 0.5 0.5+ 0.6 0.6 0.7Slide17
Past Month Hallucinogen Use among People Aged 12 or Older, by Age Group: Percentages, 2017
FFR1.17Slide18
Past Month Inhalant Use among People Aged 12 or Older, by Age Group: Percentages, 2017
FFR1.18Slide19
Past Month Methamphetamine Use among People Aged 12 or Older, by Age Group: Percentages, 2017
FFR1.19Slide20
Past Year Opioid Misuse among People Aged 12 or Older: 2017
Note: Opioid misuse is defined as heroin use or prescription pain reliever misuse.Note: The percentages do not add to 100 percent due to rounding.
FFR1.20Slide21
Past Year Opioid Misuse among People Aged 12 or Older, by Age Group: 2017
Note: Opioid misuse is defined as heroin use or prescription pain reliever misuse.
FFR1.21Slide22
Past Year Heroin Use among People Aged 12 or Older, by Age Group: Percentages, 2002-2017
FFR1.22
Age Group
2002
2003
2004
2005
2006
2007
2008
2009
2010
2011
2012
2013
201420152016201712 or Older 0.2+ 0.1+ 0.2+ 0.2+ 0.2+ 0.2+ 0.2+ 0.2+ 0.2 0.2+ 0.3 0.3 0.3 0.3 0.4 0.312 to 17 0.2+ 0.1+ 0.2+ 0.1+ 0.1+ 0.1 0.2+ 0.1+ 0.1 0.2+ 0.1 0.1+ 0.1 0.1 0.1 0.118 to 25 0.4+ 0.3+ 0.4+ 0.5 0.4 0.4 0.5 0.5 0.6 0.7 0.8 0.7 0.8 0.6 0.7 0.626 or Older 0.1+ 0.1+ 0.1+ 0.1+ 0.2+ 0.1+ 0.1+ 0.2+ 0.2+ 0.2+ 0.2+ 0.2+ 0.3 0.3
0.3
0.3Slide23
Past Year Prescription Pain Reliever Misuse among People Aged 12 or Older, by Age Group: 2017
FFR1.23Slide24
Past Year Misuse of Prescription Pain Reliever Subtypes among People Aged 12 or Older: 2017
FFR1.24
Note: The figure does not show all pain reliever subtypes from the NSDUH questionnaire.Slide25
Main Reason for the Most Recent Prescription Pain Reliever Misuse among People Aged 12 or Older Who Misused Prescription Pain Relievers in the Past Year: Percentages, 2017
Note: The percentages do not add to 100 percent due to rounding.
FFR1.25Slide26
Source Where Pain Relievers Were Obtained for Most Recent Misuse among People Aged 12 or Older Who Misused Prescription Pain Relievers in the Past Year: Percentages, 2017
Note: Respondents with unknown data for the Source for Most Recent Misuse or who reported Some Other Way but did not specify a valid way were excluded.
FFR1.26Slide27
Numbers of Past Year Initiates of Substances among People Aged 12 or Older: 2017
Rx = prescription. Note: Estimates for prescription pain relievers, prescription tranquilizers, prescription stimulants, and prescription sedatives are for the initiation of misuse.
FFR1.27Slide28
Past Year Marijuana Initiates among People Aged 12 or Older, by Age Group (in Millions): 2002-2017
FFR1.28
Note: Estimates of less than 0.1 million round to 0.0 million when shown to the nearest tenth of a million.
Age Group
2002
2003
2004
2005
2006
2007
2008
2009
2010
2011
2012
2013201420152016201712 or Older 2.2+ 2.0+ 2.1+ 2.1+ 2.1+ 2.1+ 2.2+ 2.4+ 2.4+ 2.6+ 2.4+ 2.4+ 2.6+ 2.6+ 2.6+ 3.012 to 17 1.4+ 1.2 1.3 1.1 1.2 1.2 1.2 1.3 1.3 1.4+ 1.3 1.2 1.2 1.2 1.2 1.218 to 25 0.7+ 0.7+ 0.7+ 0.7+ 0.7+ 0.8+ 0.8+ 1.0+ 0.9+ 1.1+ 1.0+ 1.0+ 1.1+ 1.0+ 1.0+ 1.326 or Older 0.1+ 0.1+ 0.2+ 0.3+ 0.1+ 0.1+ 0.2+ 0.0+ 0.2+
0.2
+
0.2
+
0.2
+
0.3
+
0.4
0.4
0.5Slide29
Past Year Cocaine Initiates among People Aged 12 or Older, by Age Group (in Thousands): 2002-2017
FFR1.29
Age Group
2002
2003
2004
2005
2006
2007
2008
2009
2010
2011
2012
2013
201420152016201712 or Older 1,032 986 998 872 977 906 724+ 623+ 642+ 670+ 639+ 601+ 766+ 968 1,085 1,03712 to 17 310+ 282+ 274+ 286+ 260+ 254+ 196+ 145+ 156+ 146+ 120 94 117 112 107 9818 to 25 594+ 576+ 592+ 498+ 570+ 541+ 426+ 397+ 372+ 467+ 443+ 432+ 501+ 663 766 72926 or Older 127 128 133 87+ 147 112+ 102+ 81+ 114 56+ 76+
75
+
148
193
213
210Slide30
Past Year Heroin Initiates among People Aged 12 or Older, by Age Group (in Thousands): 2002-2017
FFR1.30
Age Group
2002
2003
2004
2005
2006
2007
2008
2009
2010
2011
2012
2013
201420152016201712 or Older 117 92 118 108 90 106 116 187+ 142+ 178+ 156+ 169+ 212+ 135 170+ 8112 to 17 39+ 25+ 31+ 18 24 16 29 19 23 38+ 21 21 13 11 8 918 to 25 66 42 46 57 56 70 58 83+ 83 100+ 95+ 66 75 57 82 4626 or Older 12 25 40 33 9 20 28 85+ 37 40 40 82 124+ 68 80+ 26Slide31
Perceived Great Risk from Substance Use among People Aged 12 or Older: Percentages, 2017
FFR1.31Slide32
Alcohol Use Disorder in the Past Year among People Aged 12 or Older, by Age Group: Percentages, 2002-2017
FFR1.32
Age Group
2002
2003
2004
2005
2006
2007
2008
2009
2010
2011
2012
2013
201420152016201712 or Older 7.7+ 7.5+ 7.8+ 7.7+ 7.7+ 7.5+ 7.4+ 7.5+ 7.1+ 6.5+ 6.8+ 6.6+ 6.4+ 5.9+ 5.6 5.312 to 17 5.9+ 5.9+ 6.0+ 5.5+ 5.4+ 5.4+ 4.9+ 4.6+ 4.6+ 3.8+ 3.4+ 2.8+ 2.7+ 2.5+ 2.0 1.818 to 25 17.7+ 17.2+ 17.4+ 17.5+ 17.6+ 16.9+ 17.4+ 16.1+ 15.7+ 14.4+ 14.3+ 13.0+ 12.3+ 10.9+ 10.7 10.026 or Older 6.2+ 6.0+ 6.3+ 6.2+ 6.2+
6.2
+
6.0
+
6.3
+
5.9
+
5.4
+
5.9
+
6.0
+
5.9
+
5.4
+
5.2
5.0Slide33
Illicit Drug Use Disorder in the Past Year among People Aged 12 or Older, by Age Group: 2017
FFR1.33Slide34
Marijuana Use Disorder in the Past Year among People Aged 12 or Older, by Age Group: Percentages, 2002-2017
FFR1.34
Age Group
2002
2003
2004
2005
2006
2007
2008
2009
2010
2011
2012
2013
201420152016201712 or Older 1.8+ 1.8+ 1.9+ 1.7+ 1.7+ 1.6 1.7+ 1.7+ 1.8+ 1.6 1.7 1.6 1.6 1.5 1.5 1.512 to 17 4.3+ 3.8+ 3.9+ 3.6+ 3.4+ 3.1+ 3.4+ 3.4+ 3.6+ 3.5+ 3.2+ 2.9+ 2.7+ 2.6 2.3 2.218 to 25 6.0+ 5.9+ 6.0+ 5.9+ 5.7 5.6 5.6 5.6 5.7 5.7 5.5 5.4 4.9 5.1 5.0 5.226 or Older 0.8 0.7 0.8 0.7 0.8 0.7 0.8 0.8 0.9 0.7 0.8 0.8 0.9 0.8 0.8 0.8Slide35
Pain Reliever Use Disorder in the Past Year among People Aged 12 or Older, by Age Group: 2017
FFR1.35Slide36
Cocaine Use Disorder in the Past Year among People Aged 12 or Older, by Age Group: Percentages, 2002-2017
FFR1.36
Age Group
2002
2003
2004
2005
2006
2007
2008
2009
2010
2011
2012
2013
201420152016201712 or Older 0.6+ 0.6+ 0.7+ 0.6+ 0.7+ 0.6+ 0.6+ 0.4 0.4 0.3 0.4 0.3 0.3 0.3 0.3 0.412 to 17 0.4+ 0.3+ 0.4+ 0.4+ 0.4+ 0.4+ 0.3+ 0.2+ 0.1 0.2+ 0.2 0.1 0.1 0.1 0.1 0.118 to 25 1.2+ 1.2+ 1.4+ 1.5+ 1.3+ 1.4+ 1.2+ 0.9 0.7 0.6 0.6 0.7 0.5 0.7 0.6 0.726 or Older 0.6+ 0.6+ 0.6+ 0.5+ 0.6+ 0.6+ 0.5+ 0.4 0.4 0.3 0.4 0.3 0.3 0.3 0.3 0.3Slide37
Heroin Use Disorder in the Past Year among People Aged 12 or Older, by Age Group: Percentages, 2002-2017
FFR1.37
Note: Estimates of less than 0.1 percent round to 0.0 percent when shown to the nearest tenth of a percent.
Age Group
2002
2003
2004
2005
2006
2007
2008
2009
2010
2011
2012
2013201420152016201712 or Older 0.1+ 0.1+ 0.1+ 0.1+ 0.1+ 0.1+ 0.1+ 0.1+ 0.1+ 0.2+ 0.2 0.2 0.2 0.2 0.2 0.212 to 17 0.1 0.0 0.1+ 0.0 0.0 0.0 0.1+ 0.1+ 0.0 0.1+ 0.1 0.0 0.1 0.0 0.0 0.018 to 25 0.2+ 0.1+ 0.2+ 0.3+ 0.2+ 0.2+ 0.3+ 0.3 0.3 0.4 0.5 0.5 0.5 0.4 0.4 0.526 or Older 0.1+ 0.1+ 0.1+ 0.1+ 0.1+ 0.1+ 0.1+ 0.1+ 0.1+ 0.1+ 0.1+ 0.2 0.2 0.2
0.2
0.2Slide38
Opioid Use Disorder in the Past Year among People Aged 12 or Older, by Age Group: 2017
Note: Opioid use disorder is defined as meeting DSM-IV criteria for heroin use disorder or pain reliever use disorder in the past 12 months.
FFR1.38Slide39
Numbers of People Aged 12 or Older with a Past Year Substance Use Disorder: 2017
Note: Estimated numbers of people refer to people aged 12 or older in the civilian, noninstitutionalized population in the United States. The numbers do not sum to the total population of the United States because the population for NSDUH does not include people aged 11 years or younger, people with no fixed household address (e.g., homeless or transient people not in shelters), active-duty military personnel, and residents of institutional group quarters, such as correctional facilities, nursing homes, mental institutions, and long-term care hospitals.
Note: The estimated numbers of people with substance use disorders are not mutually exclusive because people could have use disorders for more than one substance.FFR1.39Slide40
Alcohol Use Disorder and Illicit Drug Use Disorder in the Past Year among People Aged 12 or Older with a Past Year Substance Use Disorder (SUD): 2017
FFR1.40Slide41
Substance Use Disorder in the Past Year among People Aged 12 or Older, by Age Group: 2017
FFR1.41Slide42
Major Depressive Episode (MDE) and MDE with Severe Impairment in the Past Year among Youths Aged 12 to 17: 2017
Note: Youth respondents with unknown past year MDE data or unknown impairment data were excluded.
FFR1.42Slide43
Major Depressive Episode (MDE) and MDE with Severe Impairment in the Past Year among Youths Aged 12 to 17: Percentages, 2004-2017
FFR1.43
N/A = not available.
MDE Status
2004
2005
2006
2007
2008
2009
2010
2011
2012
2013
2014
201520162017MDE 9.0+ 8.8+ 7.9+ 8.2+ 8.3+ 8.1+ 8.0+ 8.2+ 9.1+ 10.7+ 11.4+ 12.5 12.8 13.3MDE with Severe Impairment N/A N/A 5.5+ 5.5+ 6.0+ 5.8+ 5.7+ 5.7+ 6.3+ 7.7+ 8.2+ 8.8 9.0 9.4Slide44
Major Depressive Episode (MDE) and MDE with Severe Impairment in the Past Year among Adults Aged 18 or Older: 2017
Note: Adult respondents with unknown past year MDE data or unknown impairment data were excluded.
FFR1.44Slide45
Major Depressive Episode in the Past Year among Adults Aged 18 or Older, by Age Group: Percentages, 2005-2017
FFR1.45
Age Group
2005
2006
2007
2008
2009
2010
2011
2012
2013
2014
2015
2016
201718 or Older 6.6+ 6.5+ 6.7 6.5+ 6.6+ 6.8 6.6+ 6.9 6.7 6.6+ 6.7 6.7 7.118 to 25 8.8+ 8.1+ 8.0+ 8.4+ 8.0+ 8.3+ 8.3+ 8.9+ 8.7+ 9.3+ 10.3+ 10.9+ 13.126 to 49 7.6 7.7 7.6 7.4 7.6 7.5 7.7 7.6 7.6 7.2 7.5 7.4 7.750 or Older 4.5 4.5 5.2 4.8 4.9 5.6+ 4.8 5.5 5.1 5.2 4.8 4.8 4.7Slide46
Major Depressive Episode with Severe Impairment in the Past Year among Adults Aged 18 or Older, by Age Group: Percentages, 2009-2017
FFR1.46
Age Group
2009
2010
2011
2012
2013
2014
2015
2016
2017
18 or Older
4.0
+
4.2 4.2 4.5 4.3 4.3 4.3 4.3 4.518 to 25 5.2+ 5.2+ 5.2+ 5.8+ 5.7+ 6.0+ 6.5+ 7.0+ 8.526 to 49 4.8 4.7 5.2 5.1 4.9 4.6 4.9 4.7 5.050 or Older 2.6 3.5+ 2.9 3.4 3.2 3.5+ 3.0 3.0 2.8Slide47
Any Mental Illness (AMI), Serious Mental Illness (SMI), and AMI Excluding SMI in the Past Year among Adults Aged 18 or Older: 2017
FFR1.47Slide48
Any Mental Illness in the Past Year among Adults Aged 18 or Older, by Age Group: Percentages, 2008-2017
FFR1.48
Age Group
2008
2009
2010
2011
2012
2013
2014
2015
2016
2017
18 or Older
17.7
+ 18.1 18.1+ 17.8+ 18.6 18.5 18.1+ 17.9+ 18.3 18.918 to 25 18.5+ 18.0+ 18.1+ 18.5+ 19.6+ 19.4+ 20.1+ 21.7+ 22.1+ 25.826 to 49 20.7+ 21.6 20.9+ 20.3+ 21.2 21.5 20.4+ 20.9+ 21.1+ 22.250 or Older 14.1 14.5 15.1 15.0 15.8+ 15.3+ 15.4+ 14.0 14.5 13.8Slide49
Serious Mental Illness in the Past Year among Adults Aged 18 or Older, by Age Group: Percentages, 2008-2017
FFR1.49
Age Group
2008
2009
2010
2011
2012
2013
2014
2015
2016
2017
18 or Older
3.7
+ 3.7+ 4.1+ 3.9+ 4.1+ 4.2 4.1+ 4.0+ 4.2 4.518 to 25 3.8+ 3.3+ 3.9+ 3.8+ 4.1+ 4.2+ 4.8+ 5.0+ 5.9+ 7.526 to 49 4.8+ 4.9+ 5.2 5.0 5.2 5.3 4.9+ 5.0+ 5.3 5.650 or Older 2.5 2.5 3.0 2.8 3.0 3.2 3.1 2.8 2.7 2.7Slide50
Any Mental Illness Excluding Serious Mental Illness in the Past Year among Adults Aged 18 or Older, by Age Group: Percentages, 2008-2017
FFR1.50
Age Group
2008
2009
2010
2011
2012
2013
2014
2015
2016
2017
18 or Older
14.0
14.4 14.0 13.9 14.5 14.2 14.0 13.9 14.0 14.318 to 25 14.8+ 14.6+ 14.1+ 14.8+ 15.5+ 15.2+ 15.3+ 16.7+ 16.2+ 18.326 to 49 16.0 16.7 15.7 15.3+ 16.0 16.2 15.5+ 15.9 15.8+ 16.650 or Older 11.6 12.0 12.2 12.3 12.8+ 12.1 12.3+ 11.1 11.8 11.1Slide51
Past Year Substance Use Disorder (SUD) and Major Depressive Episode (MDE) Status among Youths Aged 12 to 17: Percentages, 2017
FFR1.51Slide52
Past Year Substance Use Disorder (SUD) and Major Depressive Episode (MDE) among Youths Aged 12 to 17: Numbers in Millions, 2017
Note: Youth respondents with unknown MDE data were excluded.
FFR1.52Slide53
Past Year Illicit Drug Use among Youths Aged 12 to 17, by Past Year Major Depressive Episode (MDE) Status: Percentages, 2017
FFR1.53Slide54
Past Year Substance Use Disorder (SUD) and Mental Illness among Adults Aged 18 or Older: Numbers in Millions, 2017
FFR1.54Slide55
Past Year Substance Use Disorder (SUD) and Serious Mental Illness (SMI) among Adults Aged 18 or Older: Numbers in Millions, 2017
FFR1.55Slide56
Past Year Substance Use Disorder among Adults Aged 18 or Older with Any Mental Illness in the Past Year, by Age Group: Percentages, 2017
FFR1.56Slide57
Past Year Substance Use Disorder among Adults Aged 18 or Older with Serious Mental Illness in the Past Year, by Age Group: Percentages, 2017
FFR1.57Slide58
Suicidal Thoughts, Plans, and Attempts in the Past Year among Adults Aged 18 or Older: Numbers in Millions, 2017
FFR1.58Slide59
Suicidal Thoughts in the Past Year among Adults Aged 18 or Older, by Age Group: Percentages, 2008-2017
FFR1.59
Age Group
2008
2009
2010
2011
2012
2013
2014
2015
2016
2017
18 or Older
3.7
+ 3.7+ 3.8+ 3.7+ 3.9+ 3.9+ 3.9+ 4.0 4.0 4.318 to 25 6.8+ 6.1+ 6.7+ 6.8+ 7.2+ 7.4+ 7.5+ 8.3+ 8.8+ 10.526 to 49 4.0 4.3 4.1 3.7+ 4.2 4.0 4.0 4.1 4.2 4.350 or Older 2.3 2.3 2.6 2.6 2.4 2.7 2.7 2.6 2.4 2.5Slide60
Suicide Plans in the Past Year among Adults Aged 18 or Older, by Age Group: Percentages, 2008-2017
FFR1.60
Age Group
2008
2009
2010
2011
2012
2013
2014
2015
2016
2017
18 or Older
1.0
+ 1.0+ 1.1+ 1.0+ 1.1 1.1 1.1+ 1.1+ 1.1+ 1.318 to 25 2.0+ 2.0+ 1.9+ 1.9+ 2.4+ 2.5+ 2.3+ 2.7+ 2.9+ 3.726 to 49 1.1 1.0 1.0 1.1 1.3 1.3 1.1 1.1 1.3 1.250 or Older 0.7 0.6 0.9 0.7 0.6 0.6 0.7 0.7 0.5 0.6Slide61
Suicide Attempts in the Past Year among Adults Aged 18 or Older, by Age Group: Percentages, 2008-2017
FFR1.61
Age Group
2008
2009
2010
2011
2012
2013
2014
2015
2016
2017
18 or Older
0.5
0.5 0.5 0.5 0.6 0.6 0.5+ 0.6 0.5 0.618 to 25 1.2+ 1.1+ 1.2+ 1.2+ 1.5+ 1.3+ 1.2+ 1.6 1.8 1.926 to 49 0.4 0.5 0.4 0.5 0.5 0.6 0.5 0.5 0.5 0.450 or Older 0.3 0.2 0.3 0.3 0.3 0.3 0.3 0.3 0.2 0.3Slide62
Need for Substance Use Treatment in the Past Year among People Aged 12 or Older, by Age Group: 2017
FFR1.62Slide63
Received Any Substance Use Treatment in the Past Year among People Aged 12 or Older, by Age Group: 2017
FFR1.63Slide64
Received Specialty Substance Use Treatment in the Past Year among People Aged 12 or Older, by Age Group: 2017
FFR1.64Slide65
Received Specialty Substance Use Treatment in the Past Year among People Aged 12 or Older Who Needed Substance Use Treatment in the Past Year, by Age Group: 2017
FFR1.65Slide66
Perceived Need for Substance Use Treatment among People Aged 12 or Older Who Needed but Did Not Receive Specialty Substance Use Treatment in the Past Year: 2017
FFR1.66Slide67
Reasons for Not Receiving Substance Use Treatment in the Past Year among People Aged 12 or Older Who Felt They Needed Treatment in the Past Year: Percentages, 2017
FFR1.67
Note: Respondents could indicate multiple reasons for not receiving substance use treatment; thus, these response categories are not mutually exclusive.Slide68
Received Treatment in the Past Year for Depression among Youths Aged 12 to 17 with a Past Year Major Depressive Episode (MDE) or MDE with Severe Impairment: Percentages, 2004-2017
FFR1.68
N/A = not available.
MDE Status
2004
2005
2006
2007
2008
2009
2010
2011
2012
2013
2014
201520162017MDE 40.3 37.8+ 38.8 39.0 37.7 34.6+ 37.8 38.4 37.0+ 38.1 41.2 39.3 40.9 41.5MDE with Severe Impairment N/A N/A 46.5 43.9 42.6+ 38.8+ 41.1+ 43.5 41.0+ 45.0 44.7 44.6 46.7 47.5Slide69
Received Treatment in the Past Year for Depression among Adults Aged 18 or Older with a Past Year Major Depressive Episode (MDE) or MDE with Severe Impairment: Percentages, 2009-2017
FFR1.69
MDE Status
2009
2010
2011
2012
2013
2014
2015
2016
2017
MDE
64.3
68.2
68.1 68.0 68.6 68.6 67.2 65.3 66.8MDE with Severe Impairment 71.5 72.9 73.7 73.1 76.4+ 73.7 72.7 72.2 72.1Slide70
Sources of Mental Health Services in the Past Year among Youths Aged 12 to 17: 2017
FFR1.70
Note: Mental health service for youths aged 12 to 17 is defined as having received treatment/counseling for emotional or behavioral problems not caused by substance use.Slide71
Sources of Mental Health Services in the Past Year among Youths Aged 12 to 17: Percentages, 2009-2017
FFR1.71
Note: Mental health service for youths aged 12 to 17 is defined as having received treatment/counseling for emotional or behavioral problems not caused by substance use.
Source
2009
2010
2011
2012
2013
2014
2015
2016
2017
Specialty Mental Health Setting
12.0
+ 12.1+ 12.6+ 12.7+ 13.6+ 13.7+ 13.3+ 14.7 14.8Education Settings 12.1+ 12.4+ 11.9+ 12.9 13.0 13.2 13.2 13.1 13.3General Medical Setting 2.5+ 2.5+ 2.5+ 2.5+ 2.8+ 2.9 2.7+ 2.9 3.3Child Welfare Setting 0.4 0.4 0.6+ 0.4 0.4 0.4 0.3 0.4 0.4Juvenile Justice Setting 0.4+ 0.3+ 0.4+ 0.3+ 0.2 0.3 0.2 0.2 0.2Slide72
Type of Mental Health Services Received in the Past Year among Adults Aged 18 or Older: Percentages, 2002-2017
FFR1.72
Note: Mental health service is defined as having received inpatient care or outpatient care or having used prescription medication for problems with emotions, nerves, or mental health.
Service Type
2002
2003
2004
2005
2006
2007
2008
2009
2010
2011
2012
20132014201520162017Any Mental Health Service 13.0+ 13.2+ 12.8+ 13.0+ 12.9+ 13.3+ 13.5+ 13.4+ 13.8+ 13.6+ 14.5 14.6 14.8 14.2 14.4 14.8Inpatient 0.7+ 0.8 0.9 1.0 0.7+ 1.0 0.9 0.8 0.8+ 0.8+ 0.8 0.9 1.0 0.9 0.9 1.0Outpatient 7.4 7.1 7.1 6.8+ 6.7+ 7.0+ 6.8+ 6.4+ 6.6+ 6.7+ 6.6+ 6.6+ 6.7+ 7.1+ 6.9+ 7.5Prescription Medication 10.5+ 10.9+ 10.5+ 10.7+ 10.9+ 11.2+ 11.4 11.3+ 11.7 11.5 12.4 12.5 12.6
11.8
12.0
12.1Slide73
Type of Mental Health Services Received in the Past Year among Adults Aged 18 or Older with Any Mental Illness in the Past Year: Percentages, 2008-2017
FFR1.73
Note: Mental health service is defined as having received inpatient care or outpatient care or having used prescription medication for problems with emotions, nerves, or mental health.
Service Type
2008
2009
2010
2011
2012
2013
2014
2015
2016
2017
Any Mental Health Service
40.9 40.2+ 42.4 40.8 41.0 44.7 44.7 43.1 43.1 42.6Inpatient 3.7 3.2 2.7 3.3 3.0 3.3 3.8 3.4 3.3 3.3Outpatient 24.1 22.5+ 23.4+ 24.0 22.4+ 24.4 24.3 25.4 24.5 25.7Prescription Medication 35.5 34.8 36.9 35.6 35.3 38.9+ 38.7+ 36.7 37.1 35.7Slide74
Type of Mental Health Services Received in the Past Year among Adults Aged 18 or Older with Serious Mental Illness in the Past Year: Percentages, 2008-2017
FFR1.74
Note: Mental health service is defined as having received inpatient care or outpatient care or having used prescription medication for problems with emotions, nerves, or mental health.
Service Type
2008
2009
2010
2011
2012
2013
2014
2015
2016
2017
Any Mental Health Service
65.7 66.5 67.5 64.9 62.9 68.5 68.5 65.3 64.8 66.7Inpatient 8.6 8.6 6.7 8.8 6.2 8.3 8.8 7.0 7.6 7.6Outpatient 46.2 44.6 42.5 44.1 39.0+ 46.9 44.2 43.6 42.6 45.3Prescription Medication 59.7 61.1 61.0 58.2 57.8 62.1 61.4 57.3 58.0 58.9Slide75
Perceived Unmet Need for Mental Health Services in the Past Year among Adults Aged 18 or Older, by Mental Illness Status: Percentages, 2002-2017
FFR1.75
AMI = any mental illness; MI = mental illness; N/A = not available; SMI = serious mental illness.
MI Status
2002
2003
2004
2005
2006
2007
2008
2009
2010
2011
2012
20132014201520162017All Adults 5.4 5.1 5.1 5.1 4.8+ 4.9+ 4.7+ 5.3 4.9+ 4.6+ 4.9+ 4.6+ 4.9+ 4.6+ 4.8+ 5.5Adults with AMI N/A N/A N/A N/A N/A N/A 20.6+ 22.1 21.0+ 20.7+ 20.8+ 19.3+ 20.8+ 20.3+ 20.7+ 23.7Adults with SMI N/A N/A N/A N/A N/A N/A 43.7 46.3 42.0 43.1 41.6 38.6+ 42.9 38.2+ 39.7+ 44.2Slide76
Reasons for Not Receiving Mental Health Services in the Past Year among Adults Aged 18 or Older with a Perceived Unmet Need for Mental Health Services Who Did Not Receive Mental Health Services, by Mental Illness Status: Percentages, 2017
FFR1.76
AMI = any mental illness; SMI = serious mental illness.Note: Respondents could indicate multiple reasons for not receiving mental health services; thus, these response categories are not mutually exclusive.Slide77
Receipt of Mental Health Services and Specialty Substance Use Treatment in the Past Year among Adults Aged 18 or Older with Past Year Mental Illness and Substance Use Disorders: Percentages, 2017
FFR1.77
Note: Mental health service is defined as having received inpatient care or outpatient care or having used prescription medication for problems with emotions, nerves, or mental health. Specialty substance use treatment refers to treatment at a hospital (inpatient only), rehabilitation facility (inpatient or outpatient), or mental health center in order to reduce or stop drug or alcohol use, or for medical problems associated with drug or alcohol use.Note: The percentages do not add to 100 percent due to rounding.Slide78
Receipt of Mental Health Services and Specialty Substance Use Treatment in the Past Year among Adults Aged 18 or Older with Past Year Serious Mental Illness and Substance Use Disorders: Percentages, 2017
FFR1.78
Note: Mental health service is defined as having received inpatient care or outpatient care or having used prescription medication for problems with emotions, nerves, or mental health. Specialty substance use treatment refers to treatment at a hospital (inpatient only), rehabilitation facility (inpatient or outpatient), or mental health center in order to reduce or stop drug or alcohol use, or for medical problems associated with drug or alcohol use.