
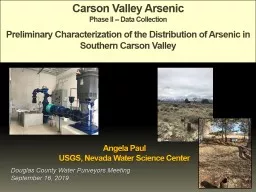
Preliminary Characterization of the Distribution of Arsenic in Southern Carson Valley Angela Paul USGS Nevada Water Science Center Douglas County Water Purveyors Meeting September 16 2019 PROBLEM ID: 909886
Download Presentation The PPT/PDF document "Carson Valley Arsenic Phase II -- Data C..." is the property of its rightful owner. Permission is granted to download and print the materials on this web site for personal, non-commercial use only, and to display it on your personal computer provided you do not modify the materials and that you retain all copyright notices contained in the materials. By downloading content from our website, you accept the terms of this agreement.


Slide1
Carson Valley ArsenicPhase II -- Data CollectionPreliminary Characterization of the Distribution of Arsenic in Southern Carson Valley
Angela Paul
USGS, Nevada Water Science Center
Douglas County Water Purveyors MeetingSeptember 16, 2019
Slide2PROBLEM
Water supply wells in northern Carson Valley were decommissioned due to elevated arsenic concentrations (Carl Ruschmeyer
, January 2013, Douglas County Public Works Director, verbal communication). Town of Minden is currently providing water from their production wells to supply water lost to consumers by the decommissioning of the wells in northern Carson Valley
Ultimate Question: Will increasing pumping rates from water supply wells in Minden mobilize arsenic toward them thereby degrading water quality?
Slide3Phase I – Recap & Phase II Objectives/Scope
Limited arsenic concentration data exist over the past 10-20 years for areas upgradient and surrounding production wells:
Update arsenic concentration distribution assessment within the target study area (n =
9 wells)
Redox conditions may be mixed and above what might be reducing for arsenic but speciation data are unavailable: Analyzed each sample collected from domestic wells for r
edox chemistry (DO, N-species, Mn, Fe, As-species, SO4
-H
2
S), DOC, and chloride
Collect samples during minimal pumping pressure (
March/April 2019
)
Slide4Minden Well #8Collaboration with water purveyors (FY2018) – Which wells are you most concerned with respect to arsenic?Arsenic concentrations above 10 µg/L (MCL) before purge; after purge, concentrations fall below MCL (Jeff Cady, Town of Minden, Water Operations Manager)Arsenic in-situ remediation study (2010) with speciation data just north of Well #8Well #8 Sampled for a suite of analytes in 2013 as part of the USGS NAWQA Program
110 – 170 250 – 270 310 – 330 430 - 510Arsenic = 9.0 µg/LScreened intervals (below land surface)Buckeye Rd.
USGS 2013 (source water)
Slide5Minden Well #8 General GW Flow (Yager et al, 2012) Sample Well
Aquifer Penetration DepthProximity to municipal supply wellLocation within general groundwater flow pathPermission by well owner to sample well
Domestic Well Selection Process
2010 In-situ remediation study
Slide6Depth Within Aquifer Representation
“49, 106, 107 ft
From Paul and others, 2010. In-situ arsenic remediation in Carson Valley, Douglas County, west-central Nevada: U.S. Geological Survey Scientific Investigations Report 2010-5161, 24 p
As(III)
As(V)
Redox Change
Moderate
Deep
Shallow
South End Douglas County Airport, 2010
392 ft
As (III)
Minden Well #11; Multiple Screened Intervals (100 to 397 ft) – Aquifer Pen. Depth = 289 ft
Shallow: ≤100 ft
Moderate: 101 to 299 ft
Deep ≥300 ft
143, 178, 200 ft
Target Aquifer Penetration Depth
Feet Below Land Surface
144 ft
Slide7Samples Collected9 Environmental Samples1 Field Blank (no speciation)3 Sequential Replicates (all parameters)Arsenic Oxidizing Bacteria (Farah Ansari, Pakistan/CSU)
Jena and Jonathan processing samples in domestic pump house.Jonathan preparing to sample for arsenic speciation. Septum used to preserve redox conditions during sampling.
Farah
Slide8AnalysesField Parameters (DO, pH, SC, temp)Nitrogen Species (NO3/NO2/NH3)Manganese and IronArsenic Speciation (AsV/AsIII)Sulfate (+H2S sniff test)Chloride, Phosphate, and DOCSamples were analyzed by USGS NWQL, USGS Trace Element Lab, and Brooks Applied Labs
Rinsing the sampling line
Slide9During this sampling effort, higher As along eastern edge of S. Carson Valley General GW Flow As < 5 ug/L 5 ug/L < As <10 ug/L As ≥ 10 ug/L
Yager
and others, 2012
Minden #8
Provisional data, subject to revision
Slide10Water Years
2006 – 2019Arsenic ConcentrationsFiltered and Unfiltered
Municipalityand USGS As Remediation Study and 2019 Data
2007 As Remediation Study
Minden Well #8
Provisional data, subject to revision
Slide11Higher arsenic concentrations observed along
the east side of the valley
<5 ug/L As
>10 ug/L As
Not sampled in 2019
August 2013 = 9 ug/L As
Saturated Zone
Unsaturated Zone
392 ft
49 to 178 ft
106 and 200 ft
107 ft
(mid-screen 570 ft below land surface)
289 ft
As (III)
As (V)
As (V)
As (V)
Aquifer Penetration Depth (APD) =
Provisional data, subject to revision
Slide12Arsenic Concentration with Depth – Phase I & II
As(III)Provisional data, subject to revision
Slide13Arsenic Concentration with Depth – with 2019 Data
As(V)As(V)As(V)As(V)As(V)As(III)
East Valley Redox Boundary?
150
300
450
600
750
900
As(V)
Provisional data, subject to revision
Slide14Change in redox conditions within the aquifer occur at:
South end of the airport: 170 feet deep within the aquiferEast side of the valley: somewhere between 178 and 392 ft APD West side of valley: unknown
<5 ug/L As
>10 ug/L As
Not sampled in 2019
August 2013 = 9 ug/L As
Saturated Zone
Unsaturated Zone
392 ft
49 to 178 ft
106 and 200 ft
107 ft
289 ft
As (III)
As (V)
As (V)
As (V)
Redox Change ?
?
Note
: Depths of changing redox conditions will not be the same throughout the basin.
Aquifer Penetration Depth (APD) =
Provisional data, subject to revision
Slide15Arsenic and Iron (Fe)
As (III)As = 0.109(Fe) + 6.35, R2=0.58, p=0.048
As = 0.555(Fe) + 3.36, R
2=0.28, p=0.282 Note: Relation in top figure is dominated by As(III) data point; reductive dissolution of metal oxides is likely liberating As into groundwater. Relation in bottom figure is not significant (p>0.05) but suggests that iron may be undergoing some degree of dissolution and releasing As(V) into groundwater (further data needed to confirm hypothesis).
Photo Credit: Core of basin-fill sediment, Susan Thiros, USGS, 2014.
Arsenic is attracted to iron oxide. Iron oxide is the rust colored material observed as a coating in basin-fill aquifer material (picture below). Under conditions oxidizing to iron, the arsenic will not be as mobile; under conditions that do not support iron rust, arsenic can have greater mobility in the groundwater (
Thiros
and others, 2014, USGS Circular 1358).
Data provisional, subject to revision
Data provisional, subject to revision
Slide16Study Findings
Higher arsenic concentrations appear to be occurring along east side of valley; upgradient from many public supply wells
All samples collected were analyzed for parameters known to be important to the mobility of arsenicIron may be influencing the mobility of arsenic in some areas/portions of the aquiferArsenic primarily observed as As(V); except in the deepest well, screened below 500 ft below land surface, which was found to support As(III)Importance: Generally, As(III) has greater mobility than As(V)
Slide17Further Work Needed
Installation of piezometers near target municipal wells during periods of irrigation and non-irrigation to evaluate groundwater levels during periods of low, moderate, and high pumping conditions
Collection of water chemistry samples from municipal supply wells and piezometers to evaluate changes in chemistry during varying pumping conditionsAdditional characterization of arsenic and important geochemical parameters in shallow, moderate, and deep water producing zones within southern Carson Valley; determine critical chemical and redox zones.Create mixing models to characterize which zones (and associated chemistries) are contributing to the chemistry observed in samples collected from water supply wells