
1 Hypothesis Tests Results of hypothesis tests fall into one of four scenarios H 0 is true H 0 is false We reject H 0 We dont reject H 0 Type I Error Correct Decision Correct Decision Type ID: 953542
Download Pdf The PPT/PDF document "Fundamental Outcomes in" is the property of its rightful owner. Permission is granted to download and print the materials on this web site for personal, non-commercial use only, and to display it on your personal computer provided you do not modify the materials and that you retain all copyright notices contained in the materials. By downloading content from our website, you accept the terms of this agreement.


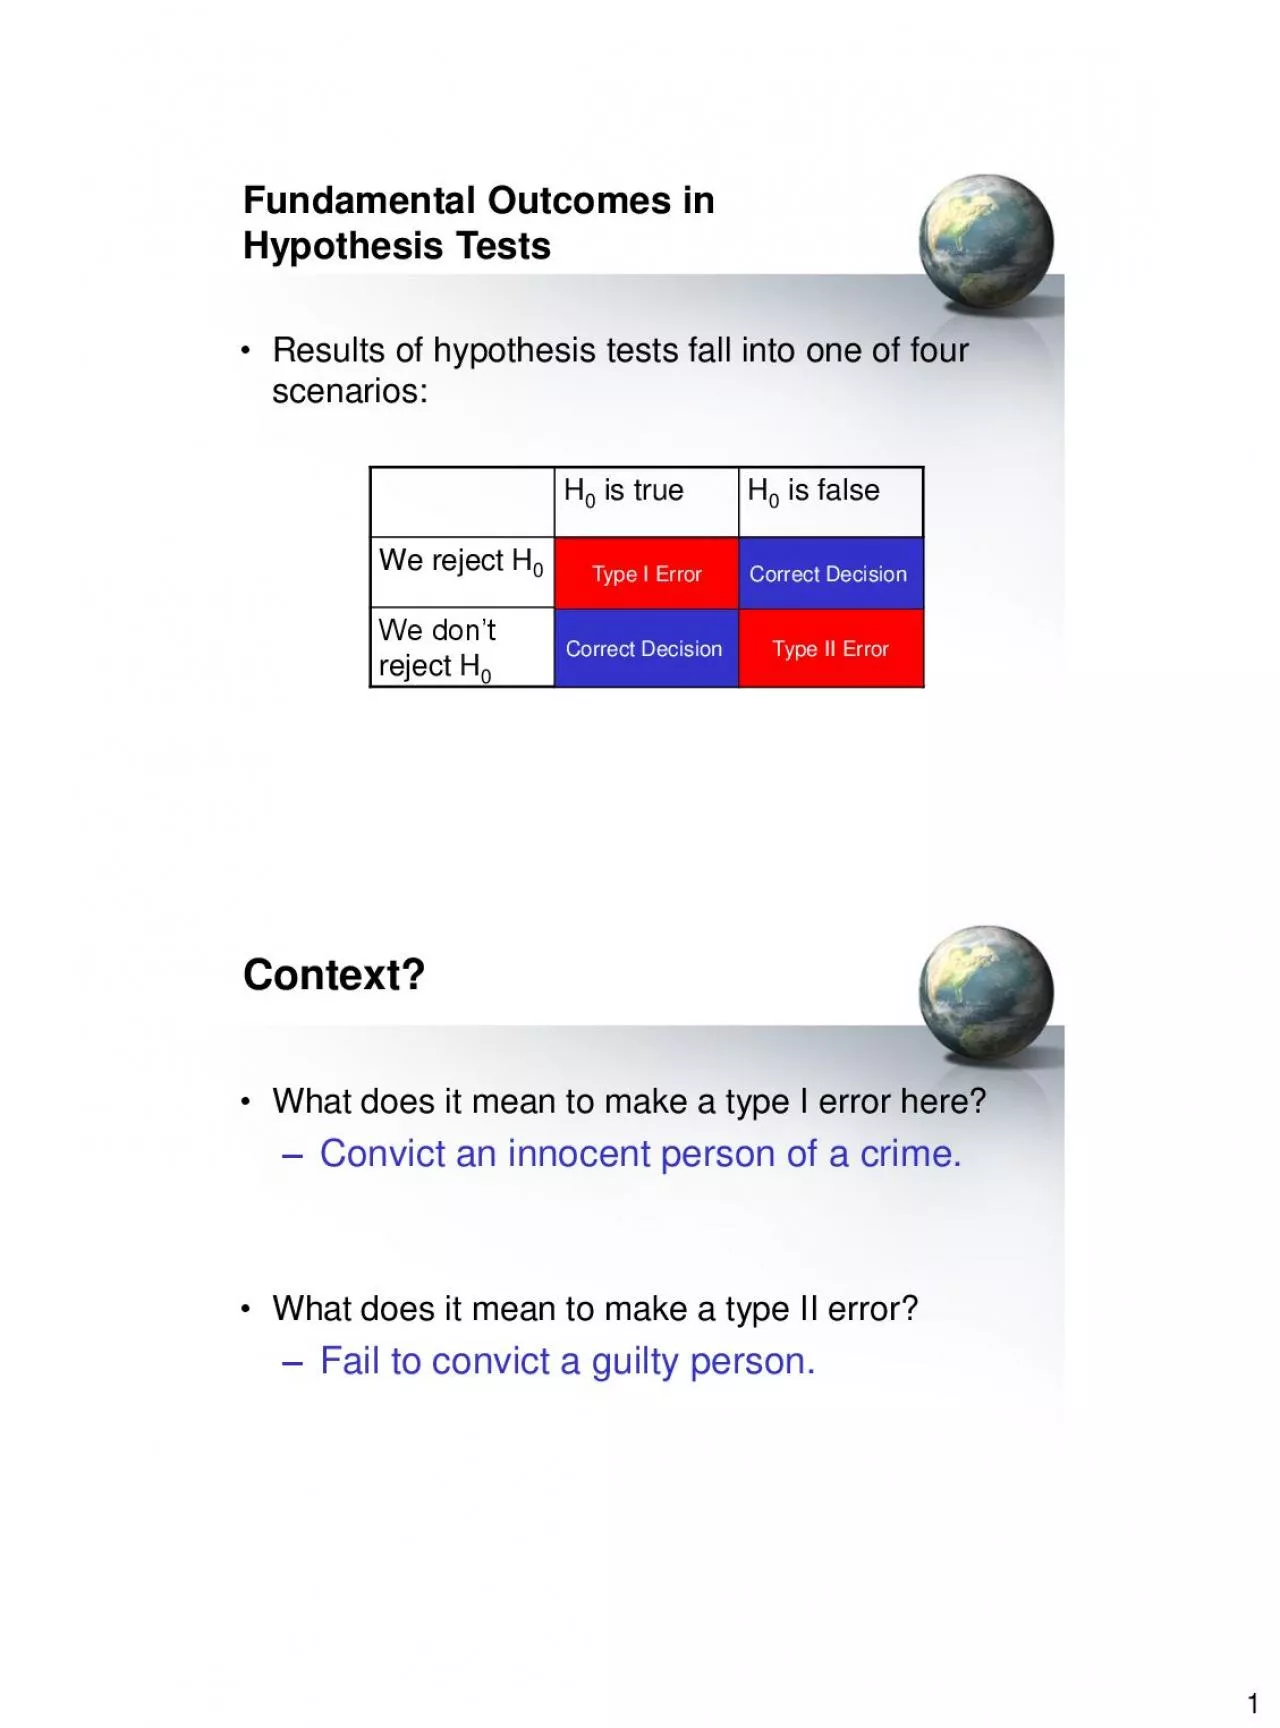
1 Fundamental Outcomes in Hypothesis Tests • Results of hypothesis tests fall into one of four scenarios: H 0 is true H 0 is false We reject H 0 We don’t reject H 0 Type I Error Correct Decision Correct Decision Type II Error Context? • What does it mean to make a type I error here? – Convict an innocent person of a crime. • What does it mean to make a type II error? – Fail to convict a guilty person. 2 Scenarios • A particular compound is not hazardous in drinking water if it is present at a rate of 25ppm (or less). A watchdog group believes that a certain water source does not meet this standard. – μ : mean amount of the compound (in ppm) H 0
: μ = 25 H a : μ � 25 – If the watchdog group decides to gather data and formally conduct this test, describe type I and type II errors in the context of this scenario and the consequences of each. Scenarios • Type I error: – Stating that the evidence indicates the water is unsafe when, in fact, it is safe. – The watchdog group will have potentially initiated a clean - up where none was required ($$ wasted). • Type II error: – Stating that there is no evidence that the water is unsafe when, in fact, it is unsafe. – The opportunity to note (and repair) a potential health risk will be missed. 3 Scenarios • A lobbying group has a been
advocating a particular ballot proposal. One week before the election, they are considering moving some of their advertising efforts to other issues. If the proposal has a support level of at least 55%, they will feel it’s “sfe” nd move money to other campaigns. – p: proportion of people who support the proposal H 0 : p = .55 H a : p .55 – If the lobbying group decides to gather data and formally conduct this test, describe type I and type II errors in the context of this scenario and the consequences of each. Scenarios • Type I error: – Stating that the evidence indicates the support level is less than 55% (and the proposal may be in
jeopardy of failing) when that is not the case. – The lobbying group will have kept advertising dollars aimed at this proposal when they could have been spent elsewhere. • Type II error: – Stting tht the proposl ppers to hve “sfe” level of support when that is not the case. – The lobbying group would shift funds away from supporting this proposal even though it may still be in need of that support. 4 Can You Tell the Difference? • A Statistics Professor has observed that for several years about 13% of students who initially enroll in his Intro to Stat course drop out before the end of the semester. A salesman introduc
es him to some computer software that may help students understand the material and stay more engaged. However the software is expensive. The salesman gives the professor a 1 - semester trial period. Type I or Type II? • Suppose the null hypothesis is that the dropout rate is 13% and the alternative is p%. • 1. The professor does not buy the software, but in reality it would have decreased the dropout rate. • 2. The professor buys the software, but the dropout rate does not change. #1 – Type 2 #2 – Type 1 5 Try Again • Many states require cars to be tested for emissions yearly. Suppose state regulators suspect a particular car repair shop ha
s certified cars that do not meet the standards. If significant evidence is found, the shop will lose its license. Type I or Type II? • The regulators revoke a license for a shop that is certifying cars correctly. • The regulators allow a shop to keep its license when it is passing cars that do not meet standards. Which error is more serious for the car shop? Which is more serious for environmental groups? #1 – Type 1 #2 – Type 2 6 Probability of Type II Error • Type II error probabilities depend on: – (Probability of a Type I Error) – sample size – population variance – difference between actual and hypothesized means Probability of Ty
pe I Error : the percentage of the time the null hypothesis would be rejected. What if they ask about power? • What is power? The ability to correctly reject the null hypothesis when it is actually false. (Detecting that the null is wrong.) Power = P(reject null | null is false) β = P(type II error) = P(don’t reject null | null is flse) Therefore: Power = 1 – β How do we increase Power? • Increase • Increase the sample size • Decrease the standard deviation (not very likely to happen.) 7 Computing Probability of Type II Error For our first scenario (the drinking water one) suppose the survey was taken on 35 water samples and th
e test was to be conducted at = 0.05 . If the actual mean concentration is 27ppm and the standard deviation is 4ppm, what is the probability of a type II error. What is the power of the test? 8 Let’s try it gin. • A tire manufacturer claims that its tires last 35000 miles, on average. A consumer group wishes to test this, believing it is actually less. The group plans to assess lifetime of tires on a sample of 35 cars and test these assumptions at = 0. 05. If the standard deviation of tire life is 4000 miles, what is the probability of a type II error if the actual mean lifetime of the tires is 32000 miles? What is the power of the test?