
For1on1Strategist PortfolioChief Investment OfficerIndustry Experience 24Years at iCM 11MBA University of ScrantonDirector of InvestmentsIndustry Experience 13Years at iCM 6MBA University of ChicagoTh ID: 869609
Download Pdf The PPT/PDF document "TacticalIncomeFactFundStrategy" is the property of its rightful owner. Permission is granted to download and print the materials on this web site for personal, non-commercial use only, and to display it on your personal computer provided you do not modify the materials and that you retain all copyright notices contained in the materials. By downloading content from our website, you accept the terms of this agreement.

1 For1on1 TacticalIncomeFact FundStrateg
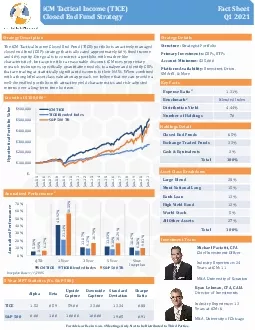
For1on1 TacticalIncomeFact FundStrategy Strategist Portfolio Chief Investment OfficerIndustry Experience: 24Years at iCM: 11MBA, University of ScrantonDirector of InvestmentsIndustry Experience: 13Years at iCM: 6MBA, University of ChicagoThe iCM Tactical Income Closed End Fund (TICE) portfolio is an actively managed closed end fund (CEF) strategy that is allocated approximately 60% fixed income and 40% equity. Our goal is to construct a portfolio with market-like characteristics, but acquire it for a reasonable discount. iCM uses proprietary research techniques, specifically quantitative models, to analyze and identify CEFs Key Growth Details BenchmarkHoldings HoldingsDetail Total100% Breakdown BankTotal100% AlphaBetaDownside1.520.5959.0033.0013.340.880.001.00100.00100.0019.050.91Date:1/1/2005 10%20%30%40%50%60%70%QTD1 Year3 Year5 YearSince iCMTICE TICEBlendedIndex 500 $100,000 $200,000 $300,000 $400,000 $500,000 $600,000Jan-05Jan-06Jan-07Jan-08Jan-09Jan-10Jan-11Jan-12Jan-13Jan-14Jan-15Jan-16Jan-17Jan-18Jan-19Jan-20Jan-21HypotheticalValue iCMTICE TICEBlendedIndex 500 For1on1 TacticalIncomeFact FundStrategy Hypotheticalperformancetolerancesforlossmightinvestmentassetsrisk.Furthermore,hypotheticalperformancebased,assumptions/rules,consideredbeenperformancerepresentedreturns.Additionally,hypotheticalperformancecertaineconomicmarketmightinvestmentassetsrisk.Finally,hypotheticalperformancesubjectcapital.Consequently,managedinvestmentstrategysubstantiallyperformancemarket.Thebacktestedperformanceshouldbeinterpretedofactualperformance,nordoestheimpactexpenseswouldmanagedfollowstrategy.predominantlyMutualstrategysoftware,generatedMorningstarenteredorderbacktestedperformancecertainMutualperformanceobtainedthroughsoftware,makesdeterminationsrelatingsalesecurities,executedfollowingmonth.hypotheticalbacktestedresultscalculatedusingmonthlyintervals,significantperformanceresultused.onlyoverviewmarketsshouldbenchmarksholdgreaterlessvolatilityinvestmentreinvestmentTheresultsreinvestmentga
2 ins.Theseresultscashflows,fees,taxes,wou
ins.Theseresultscashflows,fees,taxes,wouldshown.Performanceresultsclientsbacktestedperformancemarketotherinvestmentsfrequencymanagementstrategies,balances,otherfees,shouldconsultstatementshowperformancecomparesshouldconsiderinvestmentobjectives,chargesexpensesinvestmentstrategybeforeinvesting.Theotherotherinvestmentstrategy.Youshouldothercarefullybeforeinvesting.obtainedMorningstaraccurate,complete,timely.containedbasedbelievedaccurate,representationcomplete.subjectchange. 20092010201120122013201420152016201720182019202067.7216.256.6311.4810.1510.881.0116.2916.25-6.0825.288.765.3616.248.935.299.5710.118.001.404.9511.18-1.9316.4411.630.9026.4615.062.1116.0032.3913.691.3811.9621.83-4.3831.4918.406.17Wantwww.icm-invest.com Footnotes: Market-like refers to a broadly diversified portfolio that exhibits characteristics similar to the strategys blended benchmark (32% S&P 500/8% MSCI EAFE/38% Barclays Aggregate Bond/20% Barclays Municipal Bond/2% Cash)Blended Index comprised of 32% S&P 500/8% MSCI EAFE/38% Barclays Aggregate Bond/20% Barclays Municipal Bond/2% Cash Adjusted Expense Ratio represents the weighted-average adjusted expense ratio as reported by Morningstar Inc. The adjusted expense ratio is calculated as the funds total expense ratio minus any interest expense due to utilizing debt for leverage. This calculation allows for a useful comparison of the fees charged by mutual funds, ETFs, and closed-end funds, as funds are required to report their interest expense even if their use of leverage is profIMPORTANTDISCLOSURESperformanceresults,investmentlosemoney.assurancesperformance.Performanceresultsnetexpenses,grossotherexpenseswouldmanagementclientfees,charges,reinvestmentgains.clientsexampleManagement,chargesmanagementperformanceinvestmentmanagementclientssmallerInvestmentshares,redeemed,worthlessfees,reviewManagement,2A.performancehypothetical,performanceAugustrepresentperformancebeingpresentedonly.PerformancecalculatedBloombergperformancestrategythroughbenefithindsight.