
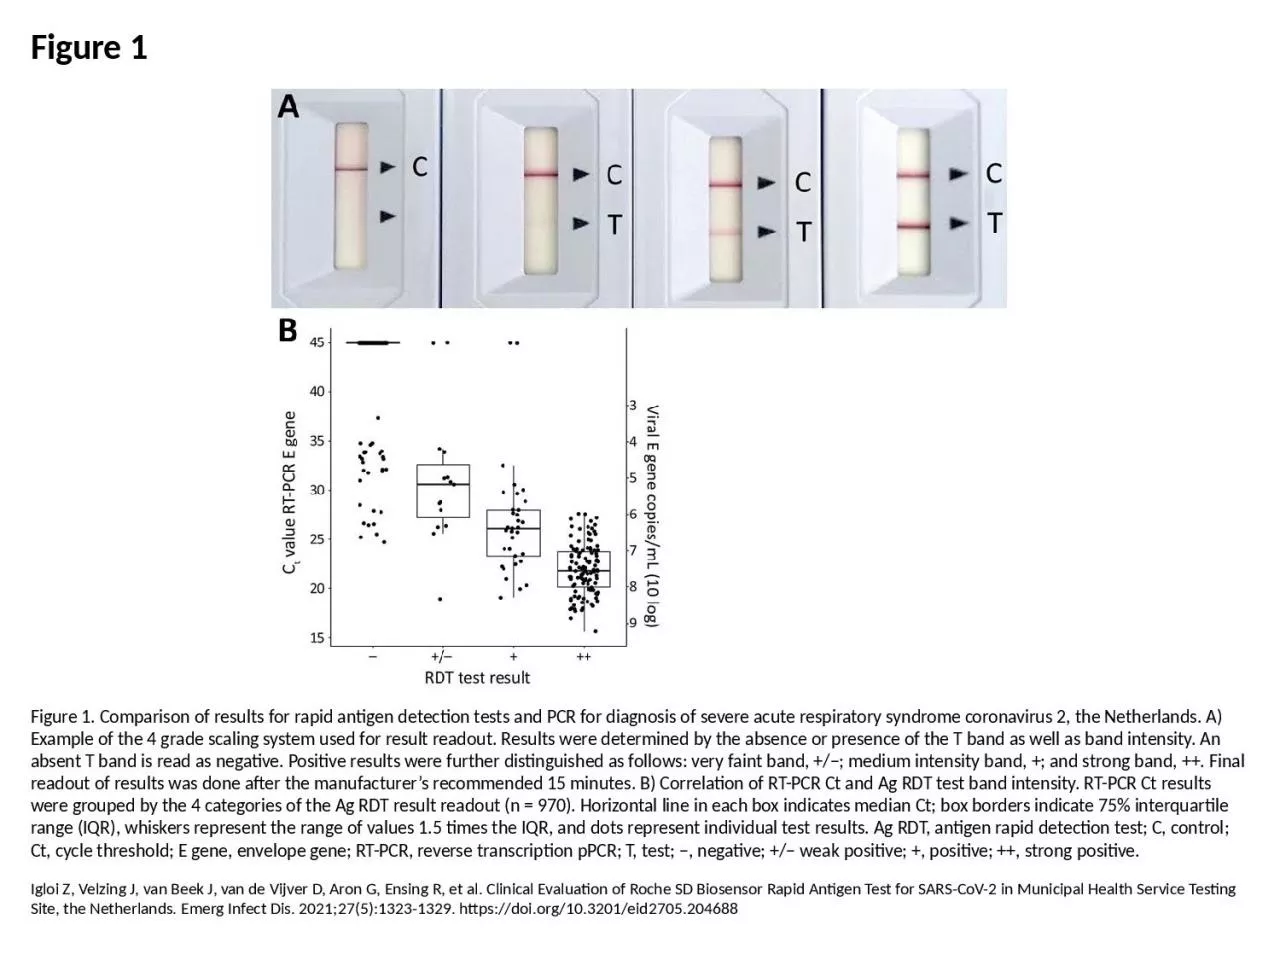
Igloi Z Velzing J van Beek J van de Vijver D Aron G Ensing R et al Clinical Evaluation of Roche SD Biosensor Rapid Antigen Test for SARSCoV2 in Municipal Health Service Testing Site the Netherlands Emerg Infect Dis 202127513231329 httpsdoiorg103201eid2705204688 ID: 1036503
Download Presentation The PPT/PDF document "Figure 1 Figure 1. Comparison of results..." is the property of its rightful owner. Permission is granted to download and print the materials on this web site for personal, non-commercial use only, and to display it on your personal computer provided you do not modify the materials and that you retain all copyright notices contained in the materials. By downloading content from our website, you accept the terms of this agreement.


1. Figure 1Figure 1. Comparison of results for rapid antigen detection tests and PCR for diagnosis of severe acute respiratory syndrome coronavirus 2, the Netherlands. A) Example of the 4 grade scaling system used for result readout. Results were determined by the absence or presence of the T band as well as band intensity. An absent T band is read as negative. Positive results were further distinguished as follows: very faint band, +/−; medium intensity band, +; and strong band, ++. Final readout of results was done after the manufacturer’s recommended 15 minutes. B) Correlation of RT-PCR Ct and Ag RDT test band intensity. RT-PCR Ct results were grouped by the 4 categories of the Ag RDT result readout (n = 970). Horizontal line in each box indicates median Ct; box borders indicate 75% interquartile range (IQR), whiskers represent the range of values 1.5 times the IQR, and dots represent individual test results. Ag RDT, antigen rapid detection test; C, control; Ct, cycle threshold; E gene, envelope gene; RT-PCR, reverse transcription pPCR; T, test; −, negative; +/− weak positive; +, positive; ++, strong positive.Igloi Z, Velzing J, van Beek J, van de Vijver D, Aron G, Ensing R, et al. Clinical Evaluation of Roche SD Biosensor Rapid Antigen Test for SARS-CoV-2 in Municipal Health Service Testing Site, the Netherlands. Emerg Infect Dis. 2021;27(5):1323-1329. https://doi.org/10.3201/eid2705.204688