
mJ cm 2 was range of UV irradiation Supplementary data Figure S2 Total phenolic and flavonoid contents of DW extract of Nypa fruticans NFD and 100 EtOH extract of Nypa ID: 1037925
Download Presentation The PPT/PDF document "Figure S1. Experimental schedule of UV i..." is the property of its rightful owner. Permission is granted to download and print the materials on this web site for personal, non-commercial use only, and to display it on your personal computer provided you do not modify the materials and that you retain all copyright notices contained in the materials. By downloading content from our website, you accept the terms of this agreement.


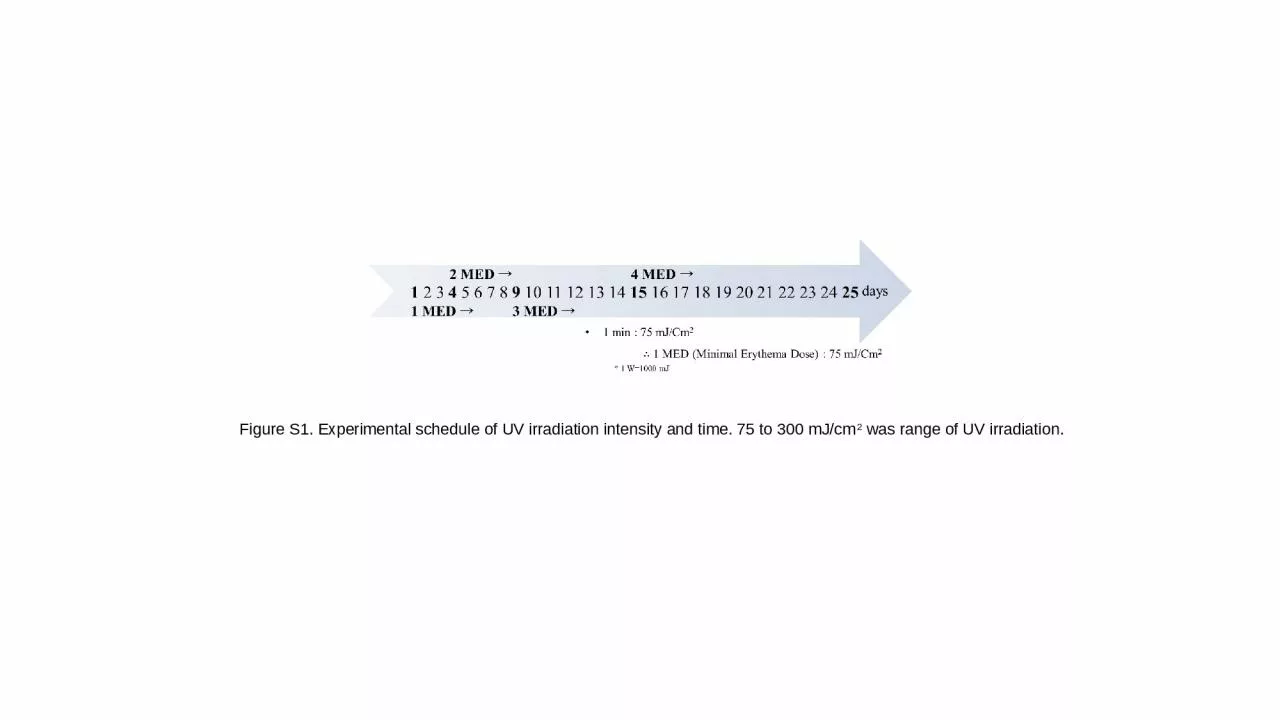
1. Figure S1. Experimental schedule of UV irradiation intensity and time. 75 to 300 mJ/cm2 was range of UV irradiation.
2. Supplementary data Figure S2. Total phenolic and flavonoid contents of DW extract of Nypa fruticans (NFD) and 100% EtOH extract of Nypa fruticans (NFE)
3. Supplementary data Figure S3. DPPH-radical scavenging activity of NFD and NFE. Ascorbic acid were used as positive control. The results are shown as means SD performed in triplicates (** P < 0.05).
4. Supplementary data Figure S4. Effects of ABTS-radical inhibition activity by NFD and NFE. Ascorbic acid were used as positive control. The results are shown as means SD performed in triplicates (** P < 0.05).
5. Supplementary data Figure S5. Reducing antioxidant capacity of NFD and NFE. It was calculated by ascorbic acid equivalent value (µM).
6. Supplementary data Figure S6. Elastase inhibition activity of NFD and NFE. EGCG was used as positive control. The results are shown as means SD performed in triplicates (** P < 0.05).
7. Supplementary data Figure S7. Cell viability of NFD and NFE using MTT assay.
8. Figure S8. Effect of NF50E on mRNA expression of Col1a1, MMP-8 and -13 were done by RT-PCR analysis.
9. Figure S9. Phosphorylation of ERK by NF50E was performed by western blot analysis.