
has not occurred in either the San Francisco or the Los Angeles area for over 100 years An earthquake of magnitude 70 or greater has not occurred in either the San Francisco or the Los Angeles area for over 100 years ID: 1022183
Download Presentation The PPT/PDF document "An earthquake of magnitude 7.0 or great..." is the property of its rightful owner. Permission is granted to download and print the materials on this web site for personal, non-commercial use only, and to display it on your personal computer provided you do not modify the materials and that you retain all copyright notices contained in the materials. By downloading content from our website, you accept the terms of this agreement.


1. An earthquake of magnitude 7.0 or greater has not occurred in either the San Francisco or the Los Angeles area for over 100 years.
2. An earthquake of magnitude 7.0 or greater has not occurred in either the San Francisco or the Los Angeles area for over 100 years.But we do know that they do occur and have devastating consequences (as can smaller earthquakes).San Francisco1906 M = 7.9 (est.)Loma Prieta 1989M = 6.9
3. STATEWIDEFor M>=6.7 earthquakesIndeed, scientists calculate significant earthquake hazards for many parts of California.
4. STATEWIDEFor M>=6.7 earthquakesHow do scientists calculate the probability of such events occurring?…Especially if they have not happened in the past?
5. Learning objectives for this activity:To use data to determine the probabilities of earthquakes of various magnitudes in the San Francisco and Los Angeles areas. To compare your results to the regional earthquake probability map for California and assess the regional earthquake hazard along this plate boundary.
6. In this exercise, you will use 30 years of earthquake history (1983-2012) to determine probabilities of large earthquakes over the next year, and over the next 30 years.The data for come from two searchable databases, based on the parameters below.
7. This presentation helps you work through the data for the San Francisco area. Then you will have the opportunity to do the Los Angeles area on your own.
8. On the worksheet, the number of earthquakes for the San Francisco area has been entered in column B.San Francisco areaABmagnitude rangetotal # of earthquakes 1983-2012(30 years)from database2.0-2.917163.0-3.913264.0-4.91615.0-5.9136.0-6.937.0-7.908.0-8.909.0-9.90Recall that earthquakes of magnitude 7.0-7.9 (and greater) have not occurred in this area during the 30-year study period, although we know they have occurred there in the past (e.g. 1906).
9. San Francisco areaABmagnitude rangetotal # of earthquakes 1983-2012(30 years)from database2.0-2.917163.0-3.913264.0-4.91615.0-5.9136.0-6.937.0-7.908.0-8.909.0-9.90Recall that earthquakes of magnitude 7.0-7.9 (and greater) have not occurred in this area during the 30-year study period, although we know they have occurred there in the past (e.g. 1906).What is the likelihood that such earthquakes (and earthquakes of other magnitude sizes) will occur in this area in the future?…Probability analysis can give an estimate of this likelihood.On the worksheet, the number of earthquakes for the San Francisco area has been entered in Column B.
10. San Francisco areaABCmagnitude rangetotal # of earthquakes 1983-2012(30 years)average # ofearthquakesper yearfrom database2.0-2.9171657.203.0-3.913264.0-4.91615.0-5.9136.0-6.937.0-7.908.0-8.909.0-9.901716/30 = 57.20On average, 57.2 earthquakes of magnitude 2.0-2.9 occur in this area every year.Column C: Calculate the average number of earthquakes that occurred in each magnitude range, by dividing Column B by 30.
11. San Francisco areaABCmagnitude rangetotal # of earthquakes 1983-2012(30 years)average # ofearthquakesper yearfrom database2.0-2.9171657.203.0-3.913264.0-4.91615.0-5.9136.0-6.937.0-7.908.0-8.909.0-9.901716/30 = 57.20Column C: Calculate the average number of earthquakes that occurred in each magnitude range, by dividing Column B by 30. Complete Column C.
12. Column C: Calculate the average number of earthquakes that occurred in each magnitude range, by dividing Column B by 30. San Francisco areaABCmagnitude rangetotal # of earthquakes 1983-2012(30 years)average # ofearthquakesper yearfrom database2.0-2.9171657.203.0-3.9132644.24.0-4.91615.375.0-5.9130.436.0-6.930.107.0-7.9008.0-8.9009.0-9.900
13. San Francisco areaABCDmagnitude rangetotal # of earthquakes 1983-2012(30 years)average # ofearthquakesper yearMRI(mean recurrence interval) in yearsfrom database2.0-2.9171657.200.0173.0-3.9132644.24.0-4.91615.375.0-5.9130.436.0-6.930.107.0-7.9008.0-8.9009.0-9.900On average, an earthquake of this size occurs in this area every 0.017 years, or every 6.25 days:0.017 yr x 365 days/yr = 6.25 days.Column D: Calculate the mean recurrence interval (MRI), or average time between earthquakes, for each magnitude range. One way to get this is to take the reciprocal of the average number of earthquakes per year.
14. San Francisco areaABCDmagnitude rangetotal # of earthquakes 1983-2012(30 years)average # ofearthquakesper yearMRI(mean recurrence interval) in yearsfrom database2.0-2.9171657.200.0173.0-3.9132644.24.0-4.91615.375.0-5.9130.436.0-6.930.107.0-7.9008.0-8.9009.0-9.900Complete Column D.Column D: Calculate the mean recurrence interval (MRI), or average time between earthquakes, for each magnitude range. One way to get this is to take the reciprocal of the average number of earthquakes per year.
15. San Francisco areaABCDmagnitude rangetotal # of earthquakes 1983-2012(30 years)average # ofearthquakesper yearMRI(mean recurrence interval) in yearsfrom database2.0-2.9171657.200.0173.0-3.9132644.20.0234.0-4.91615.370.1865.0-5.9130.432.3086.0-6.930.1010.0007.0-7.9008.0-8.9009.0-9.900Column D: Calculate the mean recurrence interval (MRI), or average time between earthquakes, for each magnitude range. One way to get this is to take the reciprocal of the average number of earthquakes per year.Straightforward for these magnitude ranges…
16. San Francisco areaABCDmagnitude rangetotal # of earthquakes 1983-2012(30 years)average # ofearthquakesper yearMRI(mean recurrence interval) in yearsfrom database2.0-2.9171657.200.0173.0-3.9132644.20.0234.0-4.91615.370.1865.0-5.9130.432.3086.0-6.930.1010.0007.0-7.9008.0-8.9009.0-9.900But how do we determine MRIs for earthquakes of greater size that have not occurred in the study period – especially when we know they have occurred in the past?Column D: Calculate the mean recurrence interval (MRI), or average time between earthquakes, for each magnitude range. One way to get this is to take the reciprocal of the average number of earthquakes per year.MRI = 1/0 ??
17. San Francisco areaABCDmagnitude rangetotal # of earthquakes 1983-2012(30 years)average # ofearthquakesper yearMRI(mean recurrence interval) in yearsfrom database2.0-2.9171657.200.0173.0-3.9132644.20.0234.0-4.91615.370.1865.0-5.9130.432.3086.0-6.930.1010.0007.0-7.9008.0-8.9009.0-9.900MRI = 1/0 ??But how do we determine MRIs for earthquakes of greater size that have not occurred in the study period – especially when we know they have occurred in the past?… we extrapolate from data for those that have occurred.Column D: Calculate the mean recurrence interval (MRI), or average time between earthquakes, for each magnitude range. One way to get this is to take the reciprocal of the average number of earthquakes per year.
18. Column D: Determining extrapolated MRIs -- On the graph, plot MRIs for earthquakes that have occurred San Francisco areaADmagnitude rangeMRI(mean recurrence interval) in years2.0-2.90.0173.0-3.90.0234.0-4.90.1865.0-5.92.3086.0-6.910.0007.0-7.98.0-8.99.0-9.9
19. Column D: Determining extrapolated MRIs San Francisco areaADmagnitude rangeMRI(mean recurrence interval) in years2.0-2.90.0173.0-3.90.0234.0-4.90.1865.0-5.92.3086.0-6.910.0007.0-7.98.0-8.99.0-9.9Draw in and extrapolate a best-fit line, then read off extrapolated MRIs for the remaining magnitudes.
20. Column D: Determining extrapolated MRI’s San Francisco areaADmagnitude rangeMRI(mean recurrence interval) in years2.0-2.90.0173.0-3.90.0234.0-4.90.1865.0-5.92.3086.0-6.910.0007.0-7.9508.0-8.9 3009.0-9.9 1600
21. San Francisco areaACDEFmagnitude rangeaverage # ofearthquakesper yearMRI(mean recurrence interval) in yearsone year probabilityof earthquake occurringof earthquake not occurringfractional%fractional%2.0-2.957.200.01700%3.0-3.944.200.023 4.0-4.95.370.186 5.0-5.90.432.308 6.0-6.90.1010.0000.90090%7.0-7.9050 8.0-8.90 300 9.0-9.90 1600 Column E: Determining the probability of an earthquake occurring in one year.
22. San Francisco areaACDEFmagnitude rangeaverage # ofearthquakesper yearMRI(mean recurrence interval) in yearsone year probabilityof earthquake occurringof earthquake not occurringfractional%fractional%2.0-2.957.200.0171.000100%00%3.0-3.944.200.0231.000100% 4.0-4.95.370.1861.000100% 5.0-5.90.432.308 6.0-6.90.1010.0000.90090%7.0-7.9050 8.0-8.90 300 9.0-9.90 1600 Column E: Determining the probability of an earthquake occurring in one year. For earthquakes with MRIs of one year or less1/1 = 1.0 or 100%
23. San Francisco areaACDEFmagnitude rangeaverage # ofearthquakesper yearMRI(mean recurrence interval) in yearsone year probabilityof earthquake occurringof earthquake not occurringfractional%fractional%2.0-2.957.200.0171.000100%00%3.0-3.944.200.0231.000100% 4.0-4.95.370.1861.000100% 5.0-5.90.432.308 0.43 6.0-6.90.1010.0000.90090%7.0-7.9050 8.0-8.90 300 9.0-9.90 1600 Column E: Determining the probability of an earthquake occurring in one year. For earthquakes with MRIs greater than one year:Fractional probability = 1 / MRI 1 / 2.308 = 0.43
24. San Francisco areaACDEFmagnitude rangeaverage # ofearthquakesper yearMRI(mean recurrence interval) in yearsone year probabilityof earthquake occurringof earthquake not occurringfractional%fractional%2.0-2.957.200.0171.000100%00%3.0-3.944.200.0231.000100% 4.0-4.95.370.1861.000100% 5.0-5.90.432.308 0.43 6.0-6.90.1010.0000.90090%7.0-7.9050 8.0-8.90 300 9.0-9.90 1600 Column E: Determining the probability of an earthquake occurring in one year. For earthquakes with MRIs greater than one year:This is also equal to the average # of earthquakes per year. But the 1/ MRI method allows calculation of probabilities for earthquakes that have not occurred - because we have extrapolated MRIs!Fractional probability = 1 / MRI 1 / 2.308 = 0.43
25. San Francisco areaACDEFmagnitude rangeaverage # ofearthquakesper yearMRI(mean recurrence interval) in yearsone year probabilityof earthquake occurringof earthquake not occurringfractional%fractional%2.0-2.957.200.0171.000100%00%3.0-3.944.200.0231.000100% 4.0-4.95.370.1861.000100% 5.0-5.90.432.308 0.43 43% 6.0-6.90.1010.0000.90090%7.0-7.9050 8.0-8.90 300 9.0-9.90 1600 Column E: Determining the probability of an earthquake occurring in one year. For earthquakes with MRIs greater than one year:Multiply by 100 to get %Fractional probability = 1 / MRI
26. San Francisco areaACDEFmagnitude rangeaverage # ofearthquakesper yearMRI(mean recurrence interval) in yearsone year probabilityof earthquake occurringof earthquake not occurringfractional%fractional%2.0-2.957.200.0171.000100%00%3.0-3.944.200.0231.000100% 4.0-4.95.370.1861.000100% 5.0-5.90.432.308 0.43 43% 6.0-6.90.1010.0000.90090%7.0-7.9050 8.0-8.90 300 9.0-9.90 1600 Column E: Determining the probability of an earthquake occurring in one year. For earthquakes with MRIs greater than one year:Multiply by 100 to get %Fractional probability = 1 / MRI Complete Column E.
27. San Francisco areaACDEFmagnitude rangeaverage # ofearthquakesper yearMRI(mean recurrence interval) in yearsone year probabilityof earthquake occurringof earthquake not occurringfractional%fractional%2.0-2.957.200.0171.000100%00%3.0-3.944.200.0231.000100% 4.0-4.95.370.1861.000100% 5.0-5.90.432.308 0.43 43% 6.0-6.90.1010.0000.1010%0.90090%7.0-7.90500.02 2% 8.0-8.90 3000.003 0.3% 9.0-9.90 16000.0006 0.06% Column E: Determining the probability of an earthquake occurring in one year.
28. We have just calculated annual probabilities of earthquakes. But what about longer time periods?The probability of an earthquake occurring over any time period is 1 (or 100%) minus the probability of the earthquake not occurring over that time period (either it happens or it does not). So, consider a two-year time period. For an earthquake to not occur over two years, two conditions must be met:1) The earthquake must not occur in the 1st year, and2) The earthquake must not occur in the 2nd year.And to get the combined probability, we multiply the individual probabilities of the two events.Thus we need to determine the probability of an earthquake not occurring in one year…and that is easy!
29. San Francisco areaACDEFmagnitude rangeaverage # ofearthquakesper yearMRI(mean recurrence interval) in yearsone year probabilityof earthquake occurringof earthquake not occurringfractional%fractional%2.0-2.957.200.0171.000100%0.000%3.0-3.944.200.0231.000100%4.0-4.95.370.1861.000100%5.0-5.90.432.308 0.43 43%0.57 57%6.0-6.90.1010.0000.1010%7.0-7.90500.02 2% 8.0-8.90 3000.003 0.3% 9.0-9.90 16000.0006 0.06% Column F: Determining the probability of an earthquake not occurring in one year. = 1.0 or 100% minus the probability of it occurring(i.e. either it happens or it does not) 1.0 - 0.43 = 0.57or 57%1.0 – 1.0 = 0.0or 0%
30. San Francisco areaACDEFmagnitude rangeaverage # ofearthquakesper yearMRI(mean recurrence interval) in yearsone year probabilityof earthquake occurringof earthquake not occurringfractional%fractional%2.0-2.957.200.0171.000100%0.000%3.0-3.944.200.0231.000100%4.0-4.95.370.1861.000100%5.0-5.90.432.308 0.43 43%0.57 57%6.0-6.90.1010.0000.1010%7.0-7.90500.02 2% 8.0-8.90 3000.003 0.3% 9.0-9.90 16000.0006 0.06% Column F: Determining the probability of an earthquake not occurring in one year. = 1.0 or 100% minus the probability of it occurring(i.e. either it happens or it does not) 1.0 - 0.43 = 0.57or 57%1.0 – 1.0 = 0.0or 0%Complete Column F.
31. San Francisco areaACDEFmagnitude rangeaverage # ofearthquakesper yearMRI(mean recurrence interval) in yearsone year probabilityof earthquake occurringof earthquake not occurringfractional%fractional%2.0-2.957.200.0171.000100%0.000%3.0-3.944.200.0231.000100%0.000%4.0-4.95.370.1861.000100%0.000%5.0-5.90.432.308 0.43 43%0.57 57%6.0-6.90.1010.0000.1010%0.9090%7.0-7.90500.02 2% 0.98 98%8.0-8.90 3000.003 0.3% 0.997 99.7%9.0-9.90 16000.0006 0.06% 0.9994 99.94%Column F: Determining the probability of an earthquake not occurring in one year.
32. Now we have the information we need in order to determine earthquake probabilities for time periods longer than one year. For example:What is the probability of a 6.0-6.9 earthquake occurring in the San Francisco area in the next 30 years?
33. San Francisco areaACDEFmagnitude rangeaverage # ofearthquakesper yearMRI(mean recurrence interval) in yearsone year probabilityof earthquake occurringof earthquake not occurringfractional%fractional%2.0-2.957.200.0171.000100%0.000%3.0-3.944.200.0231.000100%0.000%4.0-4.95.370.1861.000100%0.000%5.0-5.90.432.308 0.43 43%0.57 57%6.0-6.90.1010.0000.1010%0.9090%7.0-7.90500.02 2% 0.98 98%8.0-8.90 3000.003 0.3% 0.997 99.7%9.0-9.90 16000.0006 0.06% 0.9994 99.94%First, find the probability of a 6.0-6.9 earthquake not occurring in one year.Then…
34. If the probability of a 6.0-6.9 earthquake not occurring in the San Francisco area in one year is 0.90,- the probability of it not occurring in two years is 0.90 x 0.90= 0.902 = 0.81 or 81%,- the probability of it not occurring in three years is0.90 x 0.90 x 0.90 = 0.903 = 0.729 or 73%, - the probability of it not occurring in 30 years is 0.90300.9030 = 0.042 = 4%
35. If the probability of a 6.0-6.9 earthquake not occurring in the San Francisco area in one year is 0.90,- the probability of it not occurring in two years is 0.90 x 0.90= 0.902 = 0.81 or 81%,- the probability of it not occurring in three years is0.90 x 0.90 x 0.90 = 0.903 = 0.729 or 73%, - the probability of it not occurring in 30 years is 0.90300.9030 = 0.042 = 4%And so the probability of it occurring in 30 years is1 – 0.042 = 0.958 = 96%
36. This is how scientists calculate earthquake probabilities – and thus quantify the hazard.
37. No earthquake with magnitude 7.0-7.9 has occurred in the San Francisco area over the 30-year study period. 1a. Calculate the probability of a M = 7.0-7.9 earthquake occurring in the San Francisco area in the next 30 years.1b. Do you think this is high enough to warrant concern? Why or why not?
38. Probability of a M = 7.0 - 7.9 earthquake not occurring in the San Francisco area in one year (from worksheet).0.98 = 98%Probability of a M = 7.0 - 7.9 earthquake not occurring in the San Francisco area in 30 years:0.9830 = 54.4%Probability of a M = 7.0 - 7.9 earthquake occurring in the San Francisco area in 30 years:1 – 54.4 = 45.6% or close to a 50:50 chance
39. Probability of a M = 7.0 - 7.9 earthquake not occurring in the San Francisco area in one year (from worksheet).0.98 = 98%Probability of a M = 7.0 - 7.9 earthquake not occurring in the San Francisco area in 30 years:0.9830 = 54.4%Probability of a M = 7.0 - 7.9 earthquake occurring in the San Francisco area in 30 years:1 – 54.4 = 45.6% or close to a 50:50 chance!So even though an earthquake of magnitude 7.0 or greater has not occurred in the San Francisco area in over 100 years, there is a 50:50 chance that it will occur in the next 30 years.
40. 2. Suppose that a particular area has a MRI of 30 years for earthquakes of M = 6.0-6.9. Suppose a M=6.7 earthquake occurs in that area this year. How does this affect the probability of such an earthquake occurring next year?
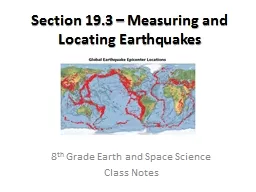
41. 3. This map shows a 99% chance of a damaging earthquake occurring somewhere in the state in the next 30 years.Should resources for earthquake preparedness be spread evenly across the state? Support your position.
42. Further applications (optional)4. Use the provided spreadsheet and graph to repeat the analysis for the Los Angeles area. What is the probability of a magnitude 7.0-7.9 earthquake in the Los Angeles area in the next 30 years? How does this compare to what you calculated for a magnitude 7.0-7.9 earthquake in the San Francisco area?