
Lester Kwiatkowski SO 4 PM 10 PM 25 Talk summary The AMO aerosols and Caribbean coral growth Using GCMs amp statistical models to resolve proximate drivers of historical AMOcoral growth correlations ID: 1033434
Download Presentation The PPT/PDF document "Anthropogenic aerosol emissions drive va..." is the property of its rightful owner. Permission is granted to download and print the materials on this web site for personal, non-commercial use only, and to display it on your personal computer provided you do not modify the materials and that you retain all copyright notices contained in the materials. By downloading content from our website, you accept the terms of this agreement.


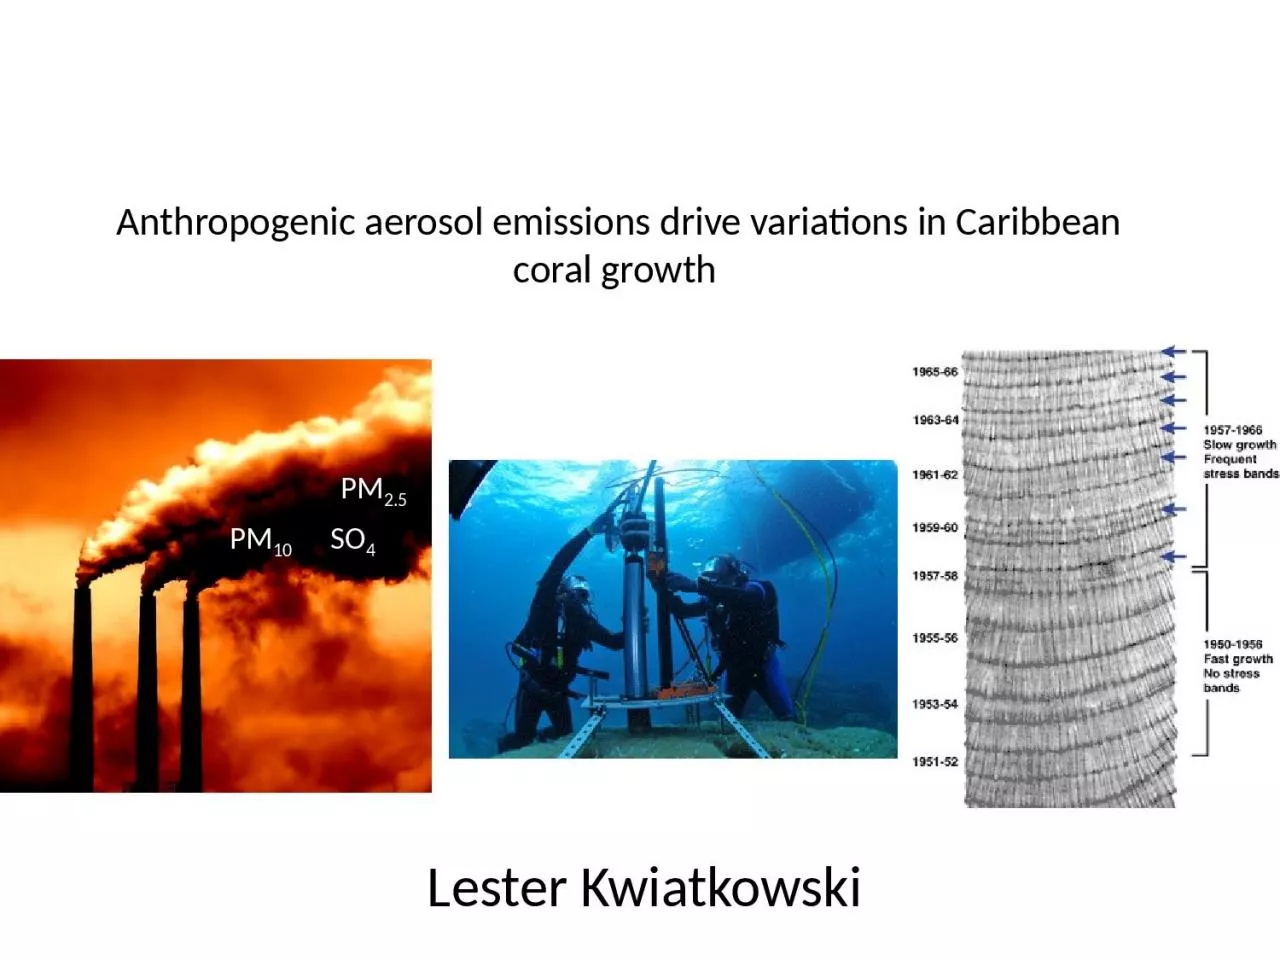
1. Anthropogenic aerosol emissions drive variations in Caribbean coral growth Lester KwiatkowskiSO4PM10PM2.5
2. Talk summaryThe AMO, aerosols and Caribbean coral growthUsing GCMs & statistical models to resolve proximate drivers of historical AMO-coral growth correlationsThe importance of anthropogenic aerosolsInforming our understanding of future Caribbean growth rates
3. A new understanding of the AMOA mode of North Atlantic SST variability previously thought to be internal to the ocean (Knight et al. 2005)Redefined by Ottera (2010), Chang (2011) & Booth et al. (2012) Nature
4. The importance of N. American Eastern seaboard SO4 throughout the 20th century The emergence of S. American industrialisation- metal smelting Central & S. American biomass emissionsCaribbean aerosol sources and typesTime0.01 0.03 0.05 0.07 0.09 0.11 0.13
5. Sample sites within the GCRMap of the Greater Caribbean Region (GCR) mean historical SST: a, Belize siteand b, Panama site. Contours give the standard deviation of the mean. Masterchonologies:Belize: 9 colonies of Montastraea faveolata (Carilli et al. 2010) Panama: 77 colonies of Siderastrea siderea (Guzman et al. 2008)
6. The AMO, coral growth and observational SSTs SSTs across the Caribbean are synchronous with the AMO Across our Caribbean sites, corals show multi-decadal signals in growth rates that have the same periodicity as the AMO- Correlations between the AMO and coral growth parameters have been shown before: Saenger et al. (2009), Helme et al. (2011)
7. Using GCMs & statistical models to resolve proximate drivers of AMO-coral growth correlationsTimes series filtered to highlight multi-decadal variabilityModified linear regressions used to systematically select the combination of GCM physical predictors (SST, SW, Ωarag) that minimise the Deviance Information Criterion (DIC) Force statistical models with the GCM physical predictors derived from fixed anthropogenic aerosol emission ensemble runs
8. Our GCM: The HadGEM2-ES Earth System ModelCollins et al. (2011)Earth system coupling feedbacksImproved aerosol scheme:More aerosol species included (8)Direct (radiation) & indirect (cloud droplet number) effects now includedAerosols coupled to vegetation scheme & ocean model (same as Booth et al. (2012))The Hadley Centre’s model for the fifth IPCC assessment report (AR5)
9. The importance of anthropogenic aerosols to the physical predictors HadGEM2-ES reasonably recreates the multi-decadal Caribbean SST variability seen in observational record With anthropogenic aerosols fixed at pre-industrial levels it does not Strong influence of aerosols on SW at Belize site post 1960Little influence of aerosols on SW at the Panama site (limited dispersal from US Eastern seaboard)
10. The influence of anthropogenic aerosols on statistical modelsBelizePanama Post-1950 “fixed aerosol” models increasingly fail to capture observational coral growth rates and diverge from the “all forcings” models because of the greater role of anthropogenic aerosols in this period Results more significant for the Belize site Post 1950, anthropogenic aerosols appear to have suppressed coral growth rates, through aerosol-driven reductions in SW and SST
11. Limited projected multi-decadal variability in SSTs and SW but projections lack volcanismHistorical multi-decadal SST variability dwarfed by the influence of global warming on projected SST anomalies Irradiance anomalies generally ↑ across the Caribbean (greater anti-air pollution policies), except in the south (e.g. Panama)Informing our understanding of future Caribbean coral growth: HadGEM2-ES SST and irradiance projectionsBelizePanama
12. ConclusionsCorals across the Caribbean show periodicity in growth rates synchronous with the AMO/aerosolsAerosol induced changes in SSTs and irradiance appear predominately driven by volcanic activity in the early 20th C. and anthropogenic SO4 in the later 20th C.Historical coral growth rates can be well modelled with HadGEM2-ES SST and SW outputsStatistical models of coral growth using “time varying” and “fixed” anthropogenic aerosol emission GCM outputs diverge in the mid-late 20th C. Our Enhanced historical understanding suggests regional aerosol emissions have the potential to decouple preconceived relationships between atmospheric [CO2] and impacts on coral growth
13. Any Questions?Thanks,Peter Cox (University of Exeter)Paul Halloran (Met Office)Peter Mumby (University of Queensland)Theo Economou (University of Exeter)Ben Booth (Met Office)Jessica Carilli (ANSTO)Hector Guzman(Smithsonian Tropical Research Institute) Funded by NERC, the University of Exeter, and the EU FORCE project.
14.
15. This is effectively a linear model with a time-dependent intercept β0(t). The intercept is assumed random, where the current value is centred on the previous one. The random intercept accounts for auto-correlation in the response while allowing for predictor effects to be assessed through the significance in βi.
16. It is not sensible to force our statistical models with future GCM outputs however:Aerosols and or other regional factors have the potential to decouple any preconceived relationships between global radiative forcing and impacts on coral growthCMIP5 model RCPs use different aerosol emission scenarios which show strong regional differences It’s likely not just the absolute [CO2] that corals care about but how you get to that [CO2]Informing our understanding of future Caribbean growth rates
17. Statistical model parameter estimates. Estimates (posterior distribution means) for SST SW and Ωarag parameters SiteParameterEstimateStandard Error95% Confidence/Credible IntervalPanamaSST0.0030.003[-0.003,0.008]SW-0.0050.004[-0.013,0.003]BelizeSST0.0080.005[0.001,0.018]SW0.0200.009[0.002,0.040]Ωarag-0.0240.015[-0.051,0.009]
18. Covariance issues
19.
20. Coral growth uncertainty. Coral growth anomalies ± the standard error of the mean (SEM) from the a, Belize and b, Panama master chronologies. 13 year filtered anomalies are shown in red.
21. Caribbean SST regimes
22. Northern Caribbean?
23. Caribbean average ΩaragWithin HadGEM2-ES, aragonite saturation state is calculated from dissolved carbon and alkalinity concentrations, temperature and salinity, following Peng et al. (1987), and assuming the calcium concentration to be in a fixed ratio with salinity. The physical and chemical fields used within the carbonate chemistry calculation are all simulated interactively within the HadGEM2-ES model; the CO2 partial pressure calculated contemporaneously with the saturation state has been shown to validate well at the Bermuda Atlantic Time-Series (BATS), and spatially against observations.
24. ModelHistoricalRCP 2.6RCP 4.5RCP 6.0RCP 8.5CanESM2555NA5CCSM455555cnrm-cm51011NA5CSIRO-Mk3-6-01010101010GFDL-ESM2G11111GISS-E2-R1631533HadGEM2-ES44444inmcm41NA1NA1IPSL-CM5A-LR43414IPSL-CM5A-MR111NA1MIROC543313MPI-ESM-LR333NA3MRI-CGCM351111NorESM1-M31111
25. Annual mean degree heating month (DHM) values from 2040-2049 for (a) RCP 2.6, (b) RCP 4.5, (c) RCP 6.0 and (d) RCP 8.5. Outputs utilise uniform prior weighting of GCMs.
26. Fraction of the (a) Caribbean, (b) Central Indian Ocean, (c) Central Pacific, (d) East Pacific, (e) Great Barrier Reef, (f) Middle East, (g) Micronesia, (h) Polynesia, (i) South East Asia, (j) Western Australia, and (k) West Indian Ocean regions showing severe (DHM>2) coral bleaching against the mean near surface temperature (TAS) anomalies associated with RCP 2.6 (blue), RCP 4.5 (green), RCP 6.0 (yellow) and RCP 8.5 (red). Outputs utilise uniform prior weighting of GCMs and are 10 year filtered. Anomalies are calculated relative to the 1860-1900 mean of each GCM and 95% confidence intervals are shown with dashed lines.
27. Fraction of the (a) Caribbean, (b) Central Indian Ocean, (c) Central Pacific, (d) East Pacific, (e) Great Barrier Reef, (f) Middle East, (g) Micronesia, (h) Polynesia, (i) South East Asia, (j) Western Australia, and (k) West Indian Ocean regions with at least 2 severe (DHM>2) coral bleaching events in the previous decade for RCP 2.6 (blue), RCP 4.5 (green), RCP 6.0 (yellow) and RCP 8.5 (red). Outputs utilise uniform prior weighting of GCMs and are 10 year filtered. Dashed lines show 95% confidence intervals. Dashed lines show 95% confidence intervals.
28. 0.01 0.03 0.05 0.07 0.09 0.11 0.13