
P gWestinghouse Learning CorporationContract No N0060068C1525AN ANALYSIS AND EVALUATIONOFINSTRUCTIONAL METHODOLOGY FORA MULTIMEDIA COURSE IN LEADERSHIPPSYCHOLOGY AND MANAGEMENTPHASE III EVALUAT ID: 884355
Download Pdf The PPT/PDF document "Doman illtESUME349ifirtii0 494WtMaEnteei..." is the property of its rightful owner. Permission is granted to download and print the materials on this web site for personal, non-commercial use only, and to display it on your personal computer provided you do not modify the materials and that you retain all copyright notices contained in the materials. By downloading content from our website, you accept the terms of this agreement.


1 Doman illtESUME349-ifirtii0 494,W.tMaEnt
Doman illtESUME349-ifirtii0 494,W.tMaEnteei - Roxanne;- .R4yerSi,_,Legot.C..-0114:_..InfrOdUct400.421-1PiralitatiOkOt__InSt.rUCtional._ Methodology,for .a !!nitinedia..Gourae°in,LeaderStiP,P.Sydholegy_,,APPOrt,7.1118.#01iI108_Acadelicri,atiOlittet Westinghouse -Learning.,Mitt'hter.! orticational_lietearch and--DeveTIC-4T--15..88=17100118,see:. .:010:and Et4-1810 119/0-40=1,4*-410.)29ion:Ammuilit.that_PAYCh01094;, :SOciak=P-14-040X9ciiri..TechniCal Reports./114,second-01t,'Qg-Stat.P*11-11W-144;;ACAdelil.;141-t--1*__:09.0rse*-0-=t4Y-44.0104-iii_ -404: Aistutges4nt:_--iitts:**0:1:Ated:.-readriptki OnSt-_of',ifthe,....coUria04-fitheAlediaand,:Va:eSentration formsthe -.prO:Ced_Orea.lfdr.,:_99*0e-7-xe-ttlitiOk,lire:pitkiii4ed.;.11 _briefthrOirigh-,:p4=-410._4!0:204: ENi 010_,.L451_tlitot4h.104aPP0.4tiA9. Under418,...,8m 010 -419. ,.___and010 ,1484. ,....mothextRfir ._P- - -.gWestinghouse Learning CorporationContract No. N00600-68-C-1525AN ANALYSIS AND EVALUATIONOFINSTRUCTIONAL METHODOLOGY FORA MULTIMEDIA COURSE IN LEADERSHIP,PSYCHOLOGY, AND MANAGEMENTPHASE III EVALUATION REPORTTR 6.15May 1, 1971 Artr ItLAJto
2 AN ANALYSIS AND EVALUATIONOF INSTRUCTION
AN ANALYSIS AND EVALUATIONOF INSTRUCTIONAL MtTHODOLOGYFOR A MULTI-MEDIA COURSEIN LEADERSHIP, PSYCHOLOGY, AND MANAGEMENTPHASE III EVALUATION REPORT-CONTRACT NUMBER NO0600-7-68-C-1S2S-ABSTRACTU.S. DEPARTMENT OF HEALTH.EDUCATION & WELFAREOFFICE OF EDUCATION_THIS DOCUMENT -HAS BEEN REPRO.DUCED EXACTLY AS RECEIVED FROMTHE PERSON OR ORGANIZATIONORIG.MIMING IT.7, POINTS OF VIEW OR OPINIONS,STATEO `DO -NOTMECESSARILYREPRESENT-OFFICIAL OFFICE OF EDWCATION POSITION OR POLICY.-_.This report presentsan assessment of theeffectiveness of the secondimplementation ofthe United States Naval Academymulti-mediacourse in Leadership, Psychology and Manage=merit.DestriptiOns of the course, the mediaand presentation forms used, and theprocedures forcourse revision are provided.&brief description of the instructionalresearch involved in the project isalso given.Prepared by:Roxanne McEnteeLeRoy C. RiversApproved by:Frank B. QuirkProject ManagerWESTINGHOUSE LEARNING CORPORATION2083 WEST STREETANNAPOLIS, MARYLAND21401PILMED4ROWBBS _AVAB ECOPYI QTABLE OF CONTENTSI.Introduction..1II; -Description of the Course2=A.Non-Research Aspe
3 cts of the Course2B.RetearCh Aspects of
cts of the Course2B.RetearCh Aspects of the CbutSe311.Implementatitm12Iii. --DesCriptift- of -Effectiirehess-MeasUreS15_A. Test Item Pool15B.Administrative Pre and Posttest15C. Progress Checks16IV.Evaluation of Course Effectiveness18A.Evaluation! Based on AdministrativePre/PosttestB.Evaluation Based on Progress ChecksC.Evaluation Based on Student AttitudeV.Segments-Within-Media EffectivenessVI.Revision Procedures for Course ImprovementA. Use of Effectiveness DataB. Subjective Evaluation20253539424348 APPENDICESA.Course OutlineB.Presentation Design,Pail of 1970 LmplementationC.Module QuestionnaireD.Mean Progress Check Performance(Before Remediation)By Moddle Studied HTABLES1Administrative Tests, Frequency Distributionof Individual Gain Score Ratios212Administrative Tests, Mean CainScore RatioI3ri22Administrative Tests, Items CorrectlyAnswered by Percentage of Studentsf234Posttest Performance by Quartile(by Segment)25Obj= ectives Measured by'ProgressChecks, FrequencyDistribution= of:OiectiVeS.--bYPercentage ofStUdefitAtidihihk TheM- First Iteration276FtOquency Distribution ofSegments by PercentageStudent
4 s Attaining at Least 80% of ObjectivesBe
s Attaining at Least 80% of ObjectivesBefore and After Remediation28Progress Check Mean Percentage Correct (BeforeRemediation), Mean Time, Student Rating(High /Low) of InterestLevel of Materials30Frequency Distribution of Segments by MeanPerformande Before Remediation32Progress Checks - First and Second Implementations-Mean Percentage Correct, BeforeRemediation34Progress Check Mean Performance (BeforeRemediation), Mean Student Time,Percentageof Students Rating. Materialsas Having High/LowInterest, Averaged Across All Modules Developedin Each Medium40I11Identification by Media of the 20 Segments.Not Meeting the 80%/80% Criterion, FirstIteration47 1.INTRODUCTION- The first implementation of the Leadership, Managementand Psychology course occurred inthe spring of 1970 and.was documented-in An Analysis and Evaluationof InstructionalMethodology For A, Multimedia CoOse inLeadership, Psychologyand Management, Phase II EvalUationReport (TR-6.11), andReport of Phase II Research Findings:The Design and Methodologyfor Research on the Interaction ofMedia, Conditions ofand Student_ ChatatteristicS-fora MultimediaCo
5 urse in Leadership', Psychology andManag
urse in Leadership', Psychology andManagement, Part I:Conditions of, Instruction(TR-6.12a).During the summer of1970 the materials were revisedon the basis of empirical dataand the course was validated fora second time in the fall of1970.This report describes the fall of1970 implementation,evaluates the effectiveness of therevised materials anddiscusses the procedures used in thefinal revision cyclewhich preceded the actual installationof the course in thespring of 1971.During the second implementation,Westinghouse LearningCorporation continued itsinvestigation into the relativeeffectiveness of various media andpresentation formsemployed in the course and theirrelationships to a varietyof learner characteristics.These results will be presentedin a Phase III ResearchReport.. [12II. DESCRIPTION OF THE COURSEFor the benefit of rea4ers unfamiliar with theUSNA multimedia Leadership, Psychology and Managementcourse, this_section offers a discussion of the developmentaleffort and rationale underlying thecourse, a description ofthe course as it was constituted in thesecond validationrun, and a description of th
6 e system used in the fall of 1970'implem
e system used in the fall of 1970'implementation..A.Non-Research Aspects of the CourseContent Outline and Objectives.The content outlinefor the course was developed jointlyby WLC and the USNANaval s'cience Department,Sources for the content outlinewere WLC and USNA subject matter experts,texts on managementand naval science, and excerptedmaterials used in thetraditional USNA Leadership Managementcourse.Referencesources were presented in bibliography form at the end ofthe content outline for eachpart of the course.Once thenature of the content was determined, rough drafts ofbehavioral objectives were developed.In the process of developing objectives, theactualsequencing and outlining of totalcourse content was completed.The sequencing of topics within eachlevel of the course wasgenerally determined by input from subjectmatter experts andprecisely determined by behavioral analysis.See SequencingRationale.(TP-6.2)4 1.iti11FlSpecificbehavioral objectives were developedat twolevels for each topic heading within a segment.Terminalobjectives (high level problem` solving objectives)weredeveloped for each major
7 heading.Enabling objectives(lower level
heading.Enabling objectives(lower level objectives) were developed wherenecessary tofjensure the learning of information essential to the attain-ment of terminal objectives.Content Organization.The content is divided intotwelve parts, each repreiehtinga' major content area.Each'part is divided into varying numbers ofsegments, rangingfrom as.few as two in Part Ito as many as ten segments inPart V.A segment is a collection of learning objectivesclosely related by content which'can be studiedin about anhour's time.The segment serves as the logistical chitinimplementation for purposes of scheduling andassessment ofstudentprogress through the course .materials.Appendix A lipts the,.titles of each of the parts andsegments in the course.Depending on-its intended use,a segment is classifiedas core, depth core, or enrichment.The 59 core segmentsinclude all of the information requisiteto the attainmentof the behavioral objectives.The student is required tocomplete all the core segments in the orderin which theyare sequenced.Depth core segments are in-classgroupdiscussions which are structured to provide "in-dep
8 th".examination of various concepts lear
th".examination of various concepts learnedin core segments.The selection of depthcore segments is made by the instructor.In the second validationrun, six depth core segments were scheduled 4with required student attendance.Enrichment segmentsare relatedto but not essential to themastery ofterminal objectives.They are optional for students whodesire'more informationthan that presented incore segments.itAn additional content unit, themodule, was createdtocarry the research experiments whichare explained in thefollowing section of this report.A. module is a vehicle.Iiemployed for the development andpresentation of materials inriwhich research variablesare manipulated,Several parallelmodules. were prepared in each:segment utiliied for researchIIpurposes, representing variations specifiedby the experimentaldesigns.The different modules ofa segment are distinguishable.1-1from one another by differencesin presentation variablesand/or media, although thecontent is the same.B.Research Aspectsof the Course.Dimensions of Presentation.Concommitant with the11identification and sequencing ofcourse content and objec
9 tives,[1WLC developed a series ofinstruc
tives,[1WLC developed a series ofinstructional research hypotheseswhich were tested in thefirst implementation and retestedin11.the fall of 1970 run of thecourse.A detailed explanationriof the instructional researchdesign can be found in theReport of Phase II Research FindinsPart I. Conditions ofInstruction (TR-6.12a) and in theforthcoming Phase IIIResearch Report.In this report only tie basicdimensions1.1of the researchare given. S11*Research hypotheses were basedon concepts presented11in A Behavioral Approach to InstructionalDesign and MediaSelection, in which a distinction is made betWeentheimportance of media:andpresentation forms (Tosti andBall,1969).The distinction is that the mediumis only the modeof transmission of information whereasthe truly importantcharacteristics of instructionare the forms of presentation'of the information within 'the medium.Any medium can bedescribedwith respect to its characteristicpresentationdimensions and withrespect to its capability for varying thedimensions of presentatiolk.The most basic dimensions ofpresentation which characterizea medium are the form andfreque
10 ncy of the stimulus,response, and manage
ncy of the stimulus,response, and management decisions.In matrix form these dimensionsare:Stimulus11Its'..ResponseManag-mentForm'Stimulus representationResponse demand formManagement formFrequencyDurationResponse demand frequencyManagement frequencyStimulus representation is the formin which the stimulusis presented.It can be written, spoken,or pictoiial.Stimulus duration is'the temporalstability of the stimulus.Duration can be transient, suchas movies and lectures, orpersistent, suchas textbooks or other.printed matter.11Response demand form. is the type ofresponse the student isI.]re4uired to make.The form of theresponse demanded can becovert or .various forms of overtresponses.Response demand 6frequency is the frequency with which thestudent is requiredto respond.The frequency with which questionsare askedwithin an instructionalsequence can be high, medium, or low.Management form is the type of remediation thestudentis given.It can be multilevfl- remediation by differinglevels of response demari frequency withina single form;H111rultiform - remediation bya different form of presentation;repetition-
11 a simple repeat of the same presentation
a simple repeat of the same presentation; or'11.error diagnostic - remediation by branching accordingto11specific incorrect responses.Management frequency is thefrequency with which the presentationis repeated oechangedaccording to the need for remediation.The frequency ofmanagement can be high, mediuj, or low dependingon responsedemand frequency.The;Phase II Evaluation Report reviews therationaleunderlying initial media selection andexplaihs changes in themedia employed in the seconlimprementationas a result of thedata from the firstrun.Presentation Design:The media and presentation formsimplemented in the fall of 1970are shown schematically in thePresentation Design (Appendix B).The Presentation Designdepicts the sequenC/e of segments and themodules (media andpresentation options) available in eachsegment.In followingthePresentation Design, read from leftto right first in theupper schema and then in the lower schemaon etch page.Thestudent studied the segments in numerical order,seeing onlyonemodule in each segment.The first box in the upper leftcorner3 7LiFrof Appendix B is numbered 1.1, indicatingth
12 at it is PartOne, Segment One.The medium
at it is PartOne, Segment One.The medium in which it is developed,Syndacfic Text, is shown inside the box(the format of theSyndactic Text will be discussed later).Upon completingSegment 1.1, the student proceeds to Segment1.2, which asis indicated in the next box isa discussion booklet.Segments 1.1 and 1.2 are the onlysegments available .in onlyone media and presentation form.. Thethird segment thestudent encounters is Segment 2.1 whichis available in fourdifferent modules (vertically arrayedin four boxes).Above]each box is a three digit number.The first digit indicates1._the part, the second digit the segment, andthe third digitis the module identifier.The media and presentationdifferences between the modulesare described by the notationsinside the boxes.The last segment encountered is-Segment 12.4.Media and Presentation Variables.Media'used in thefall- of 1970 implementationwere audiotape/panelbook (AT/PB),AT Script/PB, audiotape /intrinsically programed.pooklet(AT/IPB),AT Script/IPB, computer assisted instruction(CAI),riCAI Script/IPB, linear text and syndactictext.A destriptionof-the media and each
13 . of the variationsin presentation form(
. of the variationsin presentation form(modules) within each medium is givenin this section.In the audiotape/panelbook (AT/PB)segments (2.2-2.S,Li3,1-3.4, 5.7-5.10and 7.1-7.4), instruction is delivered inlecture format by a commercial radioannouncer reading froma prepared script.The auliotapes were developed inacommercial recording facility using standardrecording tapes, it[18and were transferred to cassette cartridges forstudent use.All charts, photographs, and drawingsaccompanying theaudiotape lecture are presented in a'panelbook.Variations in the modules reflect different combinationsof three presentation conditionsresponse demand frequency,.response demand form and presence or absence of confirmation.In addition to illustrations, the panelbook containsquestionson the instructional material.The frequency with whicharesponse is required is either high (about 20 questions/panel-book) or low (about 3 questions/panelbook).The form ofthe response the student makes to these questions is eithercovert (he thinks over his answer) or overt (he records hisselection on an answer sheet).In some modules confirmat
14 ionto the questions is provided while in
ionto the questions is provided while in others the student'lever receives the correct answer.In some segments, (7.5, 9.1 and 9.2)an alternative tothe audiotape/panelbook is the audiotape script/panelbookmedium where the printed (as opposed to the audio)versionof the script is used by the student in conjunction withapanelbook.In these'segments only one presentation condition,presence or absence of content maps, is manipulated.Thecontent map is a hierarchical structuring of the terminal-1and enabling objectives in the segment and is usedas anadvance organizer by the students.Another variation in. usage of a taped medium is theaudiotape/intrinsically programed booklet (AT /IPB) combination.The instruction is delivered via theaudiotape while questions I [I9requiring an active responstare posed in the intrinsicallyprogramed booklet.The presentation variablesmanipulatedin these segments (4.4-4.7).areresponse demand frequencyand management frequency within theIPB.In the modulescharacterized by high frequency ofresponse (about 20questions/IPB), the management frequencyranges from high.(error diagnosis on ever
15 y question)to medium (errordiagnosis onto medium (errordiagnosis on")
y question)to medium (errordiagnosis on every other question)to low (no error diagnosis).In the low response demand freciuenCycondition (about-threequestions /IPB), management frequencyis also low.Theaudiotape /IPB media combination isparalleled in each caseby another media mix which is hardware-free:the audiotapescript/intrinsically programed bookletcombination.Onlyone IPB version, the high response demand frequency/highmanagement frequency version, is used inconjunction withthe script.There are two segment., 00.1 and 10.2)in which theintrinsically programed booklet is used eitherwith an,audiotape or a script and the onlypresentation dimensionmanipulated is the presenceor absence of a content map.A different medium, computer assisted'instruction (CAI),is used in some segments (12.112.4) to carry presentationvariables similar to these tested in theaudiotape/IPBsegments (4.4- 4.7).The CAI material was developed for the1500 Instructional System, utilizing thethree components ofthe system- CRT display, audio, and image projector.The LI10informational framesare presentedon the CRTscreen andimage projector.
16 The questions,which are oftens!.tuations
The questions,which are oftens!.tuationsin which thestudent has tochoose the bestcourse of action,are presented:1) on the audio,where thesituation isdescribed; 2)on the image projectdr-,where picturesofthe situationare presented alongwith the audio;3) on theCRTscreen, where thestudent is asked.to selectan answer.In each CAIsegment thereare four modules inwhichresponse demand frequencyand managementfrequencyaremanipulated iustsgsthey were inSegments 4.4-4.7.Inaddition, WLCdeveloped a fifthmodule, the CAIscript/intrinsicallyprogramed bookletfor implementationin thefall of 70run.The intent ofthis module isto offer ahardware-free versionof the CAImaterial.To more closelysimulate actualoperation of theCAI system, thepaperversion incorporatesthe script inthe IPB (whichis thehighresponse demandfrequency, highmanagement frequencyversion).Printed matterserves as the mediumfor severaltypesof materialsprepared by WLC.The linear.texts (Segments4.1-4.3, 5.1-5.6,8.1-8.3) have befendeveloped by theRULEGand EGRULmethods ofprograming(Rule-example;example-rule).These areessentially programingmethods ofpresentingarule (d
17 efinition,principle) andhaving the stude andhaving the stude")
efinition,principle) andhaving the studentidentifyan example of therule (from 2,3, or 4 choices),or present-ing an exampleand having thestudent identifythe ruleorprinciple whichis depictedin the example. 11Variations in the linear text modulesare permutationsof two presentation dimensions- response demand frequencyand response demand form..In three modules theresponse.demand frequency is high, witha question for each informationframe.The only differenceamong these modules is in thethree forms of response required of thestudent.In oneform the student is requested to underlinethe key pointsin the correct response, in another formhe records hisselection (A, B, C or D)on an answer sheet and in the thirdform he responds covertly- that is, he merely reflects uponhis answer.These three forms ofresponse are repeated usinglinear text modules whichare characterized by low responsedemand frequency.In these modules a question is askedabout every tenth frame.The remaining Irames whichwerequestion frames in the highresponse demand frequency moduleare restructured as information frames.The syndactic text (Segments 2.
18 6-2.8,6.1-6.3, and11.1-11.3) contains se contains se")
6-2.8,6.1-6.3, and11.1-11.3) contains severalsummary statements each followedby a summary quiz of about fivequestions.The presentationdimensions which are variedamong the three syndactic textmodules are management frequency,management form andresponse demand frequency.In two modules there is mediummanagement frequency, that is, the student issent to thenext summary statement if he correctlyanswers all questionson the summary quiz or he is required to studyother materialif he incorrectlyanswers any questions on the summary quiz.Esit I1I12In the two modules with mediummanagement frequency thereare two types of management forms:(1) the programedsequence, a sequence of linear frames characterizedby highresponse demand frequency and (2) the detailedsummary, aprose version of the content of the programedsequence, withno response demand required.To provide data for materialsrevision, a scrambled version of theidentical summary quizis readministered after thestudent completes the programedsequence or detailed summary.The third module developed forsyndactic text has no managen4nt condition.In this modulethe stu
19 dent simply reads thesummary statement a
dent simply reads thesummary statement and takes andscores the summary quiz.RegardleLs of his performanceonthe summary quiz, he continuesto the 'next summary statement.In some segments employing syndactictext (2.1, 2.9,3.5, 6.4) only the module with thelinear frames isused and the variables manipulatedare the presence orabsence of a specialanswer form and content maps.Finally in some segments of syndactictext (5.1-5.3,and 8.4-8.6) only thepresence or absence of content mapsis' manipulated.C;ImplementationThe second implementation of thecourse in whichforty-four USNA midshipmen participatedwas conducted in thefall of 1970.The course was administered bya full-timestaff consisting ofan on-site WLC instructor and two dataclerks.The instructor was responsible fortutoring students,S.. 13selecting and guidinggroup discussions(depth core), scheduling and adiinisteringUSNA examinationsand determining grades.The data clerks controlledmaterialsdistribution, administration of cumulativeposttests, scoringof progress checks and collection offrame response formsand questionnaires.Students were routed through thecours
20 e according toprocedures outlined in the
e according toprocedures outlined in the Student Guide.Each student hadbeen preassigned randomly toa particular module in a segmentand was required to'follow exactlyhis unique track throughthe course materials.The students were allowedto workthrough the materials at theirown speed as long as theymaintained a minimum pace which ensured.proper preparationfor depth core meetings and USNAexams.After studying asegment the student took aprogress check which was-handedout with the instructional materials.(The progress check isdiscussed in detail ina later section of this paper.)Theprogress check. was scored by the WLC staff.If the studentdid not attain a score of 80%or better on the progress check,he was required togo through a remediation cycle.In'remediating, a student reviewed instructionalmaterialspertinent to the content missedon the test items. and thenretook the progress check.If he failed to achieve 80%correct on the second trial of theprogress check, thestudent was tutored by the instructor.Of the 59 segments in thecourse, 48 were included ingroups, of 3 or 4 in research units.Upon completing each 14
21 "research unit the student was requiredt
"research unit the student was requiredto take a researchtest, the cumulative posttest (CPT), which is usedto..measure the effects of different presentation and mediaconditions on student performance.When the student studieda segment in a research unit, he took theprogress check andwent on ta the next segment.After all the segments isthe research unit were completed, the studentturned in theprogress checks for those segments, and took the CPT,The progress-checks were graded and shown tothe student ifhe scored 80% or better.If he failed to achieve the 80%LIcriterion, he had to remediate.Thus, remediation on researchsegments was postponed until after the CPTwas taken.Inthe eleven non-research segments,the student's progresscheck was graded and any remediationnecessary took placebefore the student began thenext segment. fti15III. DESCRIPTION OF EFFECTIVENESS MEASURESA.Test Item Pool1WLC developed a pool of criterion referencedtestitems to provide the capability of assessingthe effectivenessof the course.The specification for developingtest itemswas that two test items be developed for each of 12 objective
22 sitin a segment; there are thus approxim
sitin a segment; there are thus approximately1400 items inthe pool (24 x 59 = 1416).The selection of objectives tobe included-was based primarilyon the need forrepresentative coverage of terminal objectives,andI!secondarily on representativecoverage of enablingobjectives.All test items in the -pool beara one-to-onerelationship to behavioral objectives.Since both WLC andUSNA subject matter experts assisted in thedevelopment and.review of .:he test items,content validity for all items canbeassumed.Enabling objectives not covered bytest itemsin the test item poolatemeasured within the coursematerials by criterion frames.B.Administrative Pre and PosttestAdministrative tests were developedto provide aninstrument for evaluating totalcourse achievement.Theadministrative pre and posttestwas actually one 80-itemtest which was administered once at the beginning andonce. at the end of the course.(The .administrative preand posttest is distinct from USNAexaminations which were 16administered throughout thecourse by the USNA instructorfor purposes of assigning eight-week and final coursegrades.)The administrative p
23 re and posttestwas developed byrepresent
re and posttestwas developed byrepresentatively selecting test items from thetest itempool.In this way, there was at leastone test itemselected from eachsegment of the course, plusan additionaltest item from each of 21 segments.It was necessary to delete 5 test items fromtheanalysis of the administrative data because thecontent forthese items was revised substantially between theadministration of the pre and posttests.In addition thepre/posttest data for one studentwas incomplete.Thepre and posttest analyses therefore are based on 75 testitems and 43 students.C.Progress ChecksProgress checks were developed tomeasure studentachievement on each of thecore segments.They were testsmade up of a minimum of 10 criterion referenceditems drawnfrom the test item pool.On 7 of the 59 segments there weremore than 10 test items because these segments containedanunusually high number of behavioral objectives.As mentioned in the discussionon course implementation,the progress checks were handedout with the materials.Students were instructed to study.the materialand then takethe progress check.The progress checks were
24 7.orrected bythe WLC administrative staf
7.orrected bythe WLC administrative staff and if the student didnot score 80% or better, he was required to restudymaterial pertinentto the test items missed and to retake the progrestcheck.If after the second trial the studentstill did not attain80 %' op the progress check, hewas tutored on the questionshe missed.Thus the instructional system ensuredthat thestudent would learn the minimum criterionof 80% of allprogress checks test items.Since there is a one-to-onecorrespondence between the behavioralobjectives and thecriterion refefenced test.itemi, itcan be said that allstudents learned 80% of the measuredcourse objectives.17 II18IV. EVALUATION OF'COURSE EFFECTIVENESSSince the Leadership,Management and Psychologycourse isbased on a behavioral approachto instruction, themeasurement oftotal course effectiveness. is based primarilyon studenttest performance over a series of behavioralobjectives.The premise for this form of evaluationis that oncebehavioral objectives are developed fora course and every-'one agrees that theyare necessary and worthwhile objectives,then the test of the effectiveness ofthe s
25 ystem is simplywhether students attain t
ystem is simplywhether students attain the objectives.The measurement of. student performanceon statedbehavioral objectives isa technique for assessing the absoluteeffectiveness of a system.Relative effectiveness could beassessed by comparing the effectivenessof one system orportions of the system to othersystems.The relativeeffectiveness of the WLC multi-mediasystem vis l' vis theeffectiveness of theexisting USNA Leadershipcourses hasnot been assessed for thefollowing reasons:1.The evaluation of the multi-mediacourse is basedo student perfOrmance on test items coveringover 600 of theapproximately 1500 behavioral objectives.A comparison ofthe effectiveness of the multi-mediaCourse to othercourses11would therefore necessitatethe inclusion of over 600 measuredobjectives in the othercourses.To compare effectiveneisbased onfinal examinations alone wouldmean comparingeffectiveness on onlya small sample of objectives rather 19than on the wider and more reliable sample offered by theprogress check tests.2.A second consideration in multi-mediavs. existingleadership course comparisons is the possible Hawthornea
26 ndRosenthal effects which may bias resul
ndRosenthal effects which may bias results.These two effectsare respectively the tendencies 1) for students to realizethey are in an experiment and to perforin beyond typicalexpectations (Schramm, 1964)and 2)'for teachers to realizethey are being compared and thus alter their typicalpatternsof instruction. (Rosenthal, 1966).3.If the effectiveness data for the multimediacourseand the existing leadershipcourse were not identical, therewould be no way of accounting for the differences.Sinceseveral different media and fcrms of presentationare beingused in the WLC course, and since teaching methodsandmaterials vary from one USNA instructor to another,therewould be no clear cut indication of the conditionsofinstruction which account for total differences.4.Within the multi-media course, the effort is madeto compare the relative effectiveness ofone mode ofpresentation to another.In making these comparisons, allvariables except specially selected presentationor mediavariables are held constant, that is, studentsarc given thesame content, objectives and test items.Only under thesecircumstances is it possible to
27 state. thatone form ofpresentation or m
state. thatone form ofpresentation or media is relativelymore effective thananother. r.20S.The multimedia course isnot intended to supplantthe instructor in othercourses.Its intent, 'rather, istoteach effectively the.core.content requiSiteto the under-standing of Naval leadership, therebyreducing the need forthe instructor's roleas strictly a 'disseminator of information.An instructor using multimediamaterials need onlyaugmentprepared materials with personal guidanceof students.Thatis, he is able to selectpoints he would like to highlight,lead group discussions,tutor and 'counsel students, and ingeneral use his timeas a professional to inventnew andcreative ways of simulatingleadership experiences.Withthese considerations in mind,studies of the effectivenessof systems which essentiallycompare one role of theinstructor to another roleare too global to be of value.A.Evaluation Basedon Administrative PretPosttestThe most direct althoughsomewhat simplistic estimateof total course effectivenessis obtained.by comparingstudent performanceat the beginning and at the endof thecourse.For this purpose WIC develo
28 peda 7S-itemadministrative pre/posttestw
peda 7S-itemadministrative pre/posttestwhich measures performanceon arepresentative sample of theapproximately 1500 behavioralobjectives in thecourse.This test was given to thestudentsbefore they began.thecourse and again when they completedit, sothat a gain frompre to posttest could be computed.Howeverthe actual gain frompre to posttest is a relatively 11TIincomplete effectivenessindex because it doesnot take[i11into account the amount of totalgain that was possible.An index which doesrepresent how much students learnwith *espect to how much they couldhave learned is thegainscore ratio.This is the ratio of actualgain to maximumpossible gain.The formula for the gainscore ratio is:fPosttest Score)- (Pretest Score)(1 Items on Test)- (Pretest Score)The gain score ratio has been-calculatedfor eachstudent and as can beseen in Table 1, there is a widerange in the ratios witha clustering of scores in the.40 to .60 intervals.21TABLE 1Administrative Tests)Xrequency.Distribution of Individual GainScore RatiosGain Score Ratio(N=43)Number of S:udents.900to.9990.800to.8990.700to.7992.600to.6997.500to.59912.400to.49
29 910.300to.3999.200to.2992.100to.1991.000
910.300to.3999.200to.2992.100to.1991.000to.0990 at11IIFl22.Table 2 gives the means of the individualscores usedin determining the mean gain score ratio of .495 forthecourse.TABLE 2Administrative Tests)Mean Gain Score Ratio(I of Test Items=75,It of Students=43)PosttestPretestMean MaximumMean GainMean ScoreMean ScoreGain Possible GainScore Ratio53.432.221.242.8.495An evaluation of thecourse based solely on pre/posttestperformance, therefore, reveals thatthe students learned49.5% of what they could have learned.It should be notedthat in order to have amean gain scare of 100%, all 'of thestudents would have to miss all of thequestions on thepretest and answer them all correctlyon the posttest.One problem associated with theuse of gain scoreratios in general is that there isno established standardby which to gauge them.To indicate that a system is 49.5%effective may seem to indicate thatthe system is notoperating at an acceptable level ofeffectiveness.However,When the gainscore ratio is interpreted in conjunction withthe posttest average, it becomesMore meaningful.In this 23light, although the students g ai
30 ned only 49.5% ofwhat theycould have gai
ned only 49.5% ofwhat theycould have gained, their finalscores were fairly 'high,averaging 71.2% (53.4/75x 100).To interpret further the gainscore ratio it isnecessary to consider each item of the pre/posttestfromwhich the.data are derived.Table 3 provides informationon the percentage of students correctlyanswering each itemon the two tests.TABLE 3Administrative Tests,Items Correctly Answered byPercentage of StudentsNumber of Items Correctly AnsweredPercentageof StudentsPtetest(Cum)Posttest(Cum)91..0 to100.0%00181881.0 to 90.933143271.0 to 80.971084061.0 to 70.9.1020145451.0 to 60.992976141.0 to 50.91039.76831.0 to 40.913-5227021.0 to 30.996147411.0 to 20.97680.741.0 to 10.9775175By combining the lastfive intervals in Table 3, itcan beseen that.there are 14 itemson the posttest which wereanswered correctly by fewerthan Half of the students.Inlarge part these 14 itemsaccount for the low gainscore ratio. 124It was possible that these items performed poorlybecause they *tested material taught at an early point in thecourse and the students had simply failed to remember thematerial.To investigate this poss
31 ibility, the 14 test itemswere grouped i
ibility, the 14 test itemswere grouped into 4 quartiles such that quartile 1 representedtest items on material in the first 15 segments (1.1-3.4),quartile 2 the next 15 segments (3.5-5.7), quartile3 thenext 15 segments (5.8-8.3) and quartile 4 the last 14segments (8.4-12.4).The distribution of the 14 test items is:Quartile (Segments)Number of Test Items1(1.1-3.4)22(3.5-5.7)53(5.8-8.3)44(8.4-12.4)31JIt would appear, therefore, that the different time.spansbetween learning the material and answering questionson itwas not a factor in the poor performance on these items.To investigate further the impact which retentionmayhave had on overall performanceon the posttest, thepercentages of correct responses on each posttest itemweregrouped into quartiles according to thesegment which thetest item represented and a mean percent correctwas obtainedfor each quartile. 25TABLE 4Posttest Performance by Quartile (by Segment)Quartile(Segments)Number of Test ItemsMean Percent Correct1.(1.1-3.4)2269.92(3.5-5.7)1872.03(5.8-8.3)2168.94(8.4-12.4)1475.4Looking at the data in Tables 3 and:4,one may concludethat retention did
32 not influence performanceon the posttes
not influence performanceon the posttestin general or on the 14 specific items which performedpoorly.Since retention has been eliminated.asa possible explanationof low scores on some of the posttest items, thepoorperformance probably indicates either thatthe test itemitself is faulty or that the material from which itisderived needs to be re-examined with respectto the adequacywith which it is taught.B.Evaluation Based d-on Progress Checks.An evaluation of course effectiveness,which is morecomprehensive _than that basedon the administrative pre/posttestdata, is achieved by analyzingprogress check data whichmeasureperformance representativelyacross each of the 59segments in the course.Bearing in mind 'that there is ri26considerable variation among segments, the "average"segment contains 8 terminal objectives and twiceas manyenabling objectives.A progress check test is takenatthe end of each segment.The progress checks havea.minimum of'10 items (7 progress checks havemore than 10,ranging up toa maximum of 15 items).There is a testitem in each progress check for each ofthe terminalobjectives; the remaini
33 ng itemsare based on enablingobjectives.
ng itemsare based on enablingobjectives.The enabling objectives whichare not testedon the progress checks are covered by criterion frameswithin the materials.In aggregatethe progressichecksmeasure performance on 606 of the approximately 1500behavioral objectives in the course.Since there is aone-to-one correspondence between test 'items and theobjectives they measure,performance on progress checks ispresumed to be a reliable index of performancein the courseitself.As described in Section III C,the student who failsto answer correctly at least 80% of theprogress check testitems is required to restudy material testedby the incorrectlyanswered items, then retakethe progress check.If he stilldoes not obtain ascore of 80% or better on the second iteration,the student is tutored by the on-siteinstructor.Thus, thesystem ensures that the student master atleast 80% of themeasured objectives in thecourse.Table 5 is a frequency distribution of the606 progresscheck items tabulated by thepercentage of students answeringcorrectly on the first iteration..1 1fl27TABLE SObjectives Measured by Progress Checks,Frequency
34 Distribution of Objectivesby Percentage
Distribution of Objectivesby Percentage of StudentsAttai-aing Them- Firt Iteration(I Objectives = 606, # Students= 44)1 StudentsAttainingObjectivesObjectives Attained on Progress ChecksNumberCumulative &Cumulative %100%11511519.0%90 - 9923434957.680 - 8911346276.270 - 795551785.360 - 693955691.8SO - 592357995.540 - 491459397.930 - 396S9998.820 - 29S60499.710 - 19160599.80 -91606100.0Table S reveals that at least 80% of thestudents correctlyanswered 76.2% of all of theprogress check test items onthe first iteration.This indicates that the materialsingeneral are effective instructional tools.By combining*thelast 6 intervals in Table 5, it isseen that there are SO(606-556) test items-whichwere correctly answered by fewerthan 60% of the studentson the first iteration.Poorperformance on these itemscan be attributed to a faulty testitem, inadequate teaching ofthe objective, or high difficultylevel of the objective itself.During the revision cyclefollowing the fall of 1970, thesetest items/objectives were 28examined and many were altered.Improved performanceonthese items can be expectedduring the nextimplemen
35 tationof the course.The progress check d
tationof the course.The progress check data havebeen analyzed bysegmentas well as by individual objectiveto identify thosesegmentswhich were performing belowcriterion level.Table 6 is afrequency distribution ofthe segments by thepercentage of.students who correctlyanswered 80% ormore of the progresscheck test items.The segmentsare tabulated by performanceboth before and afterremediation.nTABLE 6Frequency Distribution ofSegmentsby Percentage ofStudentsrAttaining At Least 80%of ObjectivesBefore and After Remediation[1(11 Segments= 59,ifStudents = 44)1100- 9UPercentStudentsSegmentsAttaining80% orBefore RemediationAfter Remediation1.,BetterRo.aF-Ro.No.Cum No.100%33353590-99231326225780-893915870-798.4705860-6965315950-5940-4915445830-39359ri20-2910-19I]1 l1 In judging adequacy ofperformance, WLC maintainsacriterion level of 80-80, thatis, 80% of the studentsmustachieve 80% of the objectives, ifnot on the first iteration,then on the second iteration.(afterremediation) or inindividual tutoring sessions.The "After Remediation"figures inTable 6 indicatethat only one segment failedto meet the criterion level of
36 performance.However, inTable 6 "Before R
performance.However, inTable 6 "Before Remediation"data show that 20segments didnot attain the 80-80 criterionif segment performance isjudged against themore stringent standard of firstiteration performance alone.These 20 segments (and theirprogress checks)werescrutinized andrevised prior toproduction of the finalcourse materials.It is of interest tonote that of the SO test itemscited in Table Sas poor performers, 31 are found inthosesegments which failed to achievethe 80-80 criterion on thefirst iteration.Apparently, these individualtest itemswhich had low scorescontributed to lowering theperformanceof the entire segment.Tabulation. of meanscores on progress checks yieldsa different analysis ofprogress check data which is moreflexible forpurposes of comparison than the classificationof segments accordingto the percentage of students whomeetthe 80% performancecriterion.294 130TABLE 7Progress Check Mean PercentageCotrect(Before Remediation),Mean Time, Student Rating(High /Low)Of Interest Level Of MaterialsSegmentNumberMeanPercentageCorrectMeanTime(NumberMinutes)Percentage of Students RatingInterest Leve
37 l of Materialsas:HighLow1.187%9082.52.51
l of Materialsas:HighLow1.187%9082.52.51.2844839.418.22.1885165.92.32.2864846.39.82.3707618.7.23.32.4784935.711.92.5905836.612.22.6826853.912.92.7726048.70.02.8866055.52.82.9905271.12.63.1735013.516.23.2804330.010.03.3704826.315.83.4875013.824.33.5934761.55.14.1926141.023.14.2955235.920.54.3845238.412.84.4956732.517.54.5955933.315.14.6905035.915.44.7904840.510.85.1895525.712.95.2765722.510.05.3924124.49.85.48456.25.022.55.5824619.519.55.6824028.215.45.7832922.520.05.8903913.58.15.979S410.310.35.10903415.410.3 131TABLE 7 continuedSegmentMeanMeanPercentage of Students RatingNumberPercentageTimeInterest Level of Materialsas:Correct(NumberMinutes)HighLow6.1906717.112.26.28S6324.414.66.3886015.412.86.4874432.4S.47.1814118.012.97.2.874610.37.77.3803815.412.97.478'4:13.115.87.S833f,37.S2.58.1876429.321.98.2916635.017.58.3925729.312.08.4.944447.S2.58..587SO33.3S.18.687SO43.67.79.1914222.S10.09.2914222.S15.010.19S6117.029.510.291SO33.3S.111.1824219.59.8.11.2932624.49.811.3904638.SS.112.193S372.10.012.2826150.02.312.39336S8.S4.912.4834243.612.8MEAN86S134%12$Table 7 reports bysegment the average percentage11of pr
38 ogress check test itemsanswered correctl
ogress check test itemsanswered correctly beforeremediation, as wellas the average time students spentoh the instructionalmaterial in each segment and theinterest they indicated inthe materials.' Student timef 32and attitude arc discussed in detailin the-followingSection, IV. C.The remainder of this section isa discussionof mean progress check performance..Certain restrictions are inherent ininterpreting thedifferences'in progress check performanceamong the segmentswhich are shown in Table 7.The interpretation difficultiesspring from the fact that thesegments cover different content,are taught by different media and forms ofpresentation andare tested by different progress check items.Despite thesereservations it can beseen from Table 8 (derived from Table 7)thatofor whateverreasons performance is considerably betteron some segments than on others.TABLE 8Frequency Distribution of Segments byMean Performance Before RemediationrlMean4Performance,ProgressriChecks,NuMber11BeforeOfCumulativeRemediationSegmentsNumber95-99%4490-94202485-89133780-84145175-794SS70-74459Table 8 reveals thateven before remediation
39 most ofthe segmentsare performing at a
most ofthe segmentsare performing at a level equal to or higher 33than the criterion level of80%.There are 8 segmentsin1this table, however, which haveaverage scores of less than80%, indicating that theyrequire revision.These segmentshave already been identifiedas needing revision on thebasis of the 80-80 critericn.At first blush these figuresmay appear to contradict1the data in Table 6 whichidentify 20 segmentsas needingrevision because they donot meet the 80-80 criterion.This11occurs because Table 6 records thepercentage of studentsachieving 80% or betteron a progress check, and doesnotreflect the distribution ofscores above 80% correct.To1.illustrate: in a class of 5students there are 4 studentswho score 100% and 1 studentwho scores 70%.Table 6would report this dataas 80% of the students (4 out of 5)attaining 80% or better; Table8 would report thesame data11as having a mean performance of 94%.Thus, although.Table 6 shows that beforeremediation there are 20segmentsnoachieving the 80-80 criterion.Table 8 identifies only8 segments which donot have an averagescore of 80% orbetter before remediation.By
40 averaging the performancedata!or all seg
averaging the performancedata!or all segments inTable 7, it is seen that theaveragepercentage correct before remediationis 86%.Table 9 offers insight intothe general improvementin the course effectedby the revision cycle betweenthe first(Spring 1970) and second(Fall 1970) implementations. E.34TABLE 9Progress Checks - First and Second Implementations-Mean Percentage Correct, Before RemediationSegment* FirstNumberRunSecondRunSegmentNumberFirstRunSecOndRun1.182876.180901.267846.282852.178'886.391882.268866.487872.365707.169812.4'71787.283872.565907.377802.671827.478782.763727,574832.889868.182872.965908.281913.166738.3.92923:266808.476943.375708.577873.479878.677873.S84939.180914.183929.28891A.28S9510.193954.3878410.289914.4929511.180824.5829511.291934.6739011.383904.7779012.187935.1788912.285825.2707612.39493S.3749212.48583S.469845.559825.67082S.780835.89090MEAN -S.97879ALL5.106690SEGMENTS7',.!86 Following revision, performancedecreased on 5segments, remained unchangedon 3 segments, and improvedon the remaining 51 segments.The average percentage of[Iprogress check scores acrossall segments increased.by8%
41 from 78% in the firstrun to 86% in the
from 78% in the firstrun to 86% in the second,111C.Evaluation Based on Student Attitude.35Student attitudinal datawere collected on a Module Question--111naire (Appendix C) which thestudents were asked to t.ompleteat the end of each segment.It was felt that the questionnaire11would be filled out with greater candorif the students felt1ITsheltered by anonymityso no attempt was made to link studentnames with completed questionnaires.Most of the 44 studentcomplied with WLC's requestthat the questionnaires becompleted and the number of studentsresponding to thequestions is at least 40 for eachsegment.Some of the items on the questionnairewere usefulprimarily in revising thecourse materials; these itemspertained to the difficulty ofthe material, the quantity ofmilitary examples used in thematerials, the student'sapprovalof the way the materialwas presented (media and presentationI.variables), and an open-endedquestion soliciting.studentopinions.The questionnaire data tabulatedin, this report asevaluative measurescome from two items - the time the studentsspent studyinginstructional materials and their rati
42 ngona 5 - point scale of the interestlev
ngona 5 - point scale of the interestlevel of the materials (bothcontent and mode of presentation).These data are recorded 36in Table 7 (page 30) of this report.Although the actual time reported fora segment variesconsideiably among students, theaverage time/segment asreported in Table 7 is the most usefulmeasure of segmentduration.There is a wide spreadin mean times for thesegments, ranging from an average of 29 minutes for Segment 5.7to an average of 90 minutes for Segment.1.1.The averagetime across all segments, however, is 51 minutes whichisvery close to WLC's general.guideline of developing segmentswhich would require SO to 60 minutes of study time.Usingthe Module Questionnaire time data, itcan he estimated thattotal instructional time for the course is 3000 minutes(S1 min. x 59 segments) or about 50 hours.This figureis too low to reflect the actual time the students investedin the course because it does not include timespent taking..the S9 progress checks (59 x 15 minutes7 15 hours), taking1the /. 4 cumulative posttests (14 x 40 minutes= over 9 hours),taking the 4 USNA tests (4 x 50 minutes= over
43 3 hours) andIIattending the 6 depth cor andIIattending the 6 depth cor")
3 hours) andIIattending the 6 depth core meetings (6x 50 minutes = 5 hours).When these time figures are added to. the SO hours ofNinstructional time, the total time becomes 82 hours.In11addition to these 82 hours, all students spentsome time beingprocessed as they handed in materials, had theirprogresschecks graded and received the next set of materials.Furthermore, those students who did notscore the minimum of80% correct on the first taking of theprogress check wererequired to take the time to restudy pertinent material and 37retake the progress check.When the 82-hourfigure isinflated to incorporate theseactivities, it approximates100 hours.Excluding holidays,a semester at the USNAlasts about 14 1/2 weeks;when the 100 hoursare distributedover 14 1/2 weeks, theaverage amount of time thestudentsspent per week is 7 hours(10u2.-- 14.5). Sevenhours isI-;definitely in line with theaverage number of hoursa studentis expected to spendon a conventional 3-creditcourse in11which he attends 3 hoursof lecture and isassigned 3 -6 hoursof homework each week.The foregoing discussionof time data has been7included in
44 the sectionon student attitude becausei
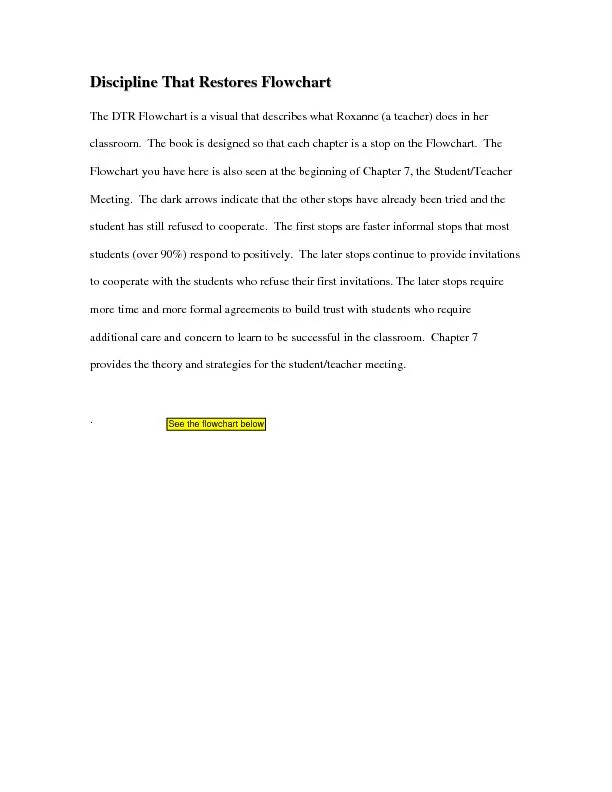
the sectionon student attitude becauseit issometimes thecase that if students feela course is tootime-consuming relativeto their other courses, theytendto view it witha jaundiced eye. The time datareported bythe students reveal,however, that this shouldnot be aproblem with the WLCcourse.In the next implementationof the course the numberofhours the student spendswill decrease considerablybecausethe cumulativeposttests (9 hours) will notbeadministered,the materials willbe distributed in largerblockstherebyfacilitating processing,and the segments whichdid notmeet the 80-80 criterionwill be improvedso the incidencesof remediation andtutoring will decline.For the nextimplementation the time thestudent must invest in thecoursewill likely notexceed 6 hoursper week.It£ 38The second type of studentattitudinal data, reportedas an effectiveness measure becauseit impacts studentacceptance of the course, is the students'rating of theirinterest in the materials.In response to questionnumber1I2 on the Module Questionnaire,"Was the material interesting?)"the students circledthedescription they felt mostappropriate.It
45 Summary data on theresponses to this que
Summary data on theresponses to this questionare reportedin Table 7, page 30, withthe Questionnaire ratingsof "high"[Iand "above average" collapsedinto a single categoryrepresenting "high" interestand the ratings of "lielow1111Iaverage" and "low" similarlycollapsed into a single "low"category.These data in Table 7are reported as thepercentages of students whoexpress high or low interest inthe materials.Not reported are thepercentages of studentswho rate the materials"average" - thiscan be calculated byIIsubtracting from 100% the summedpercentages of students inthe high and low categories.In five segments employingaddiotapes the percentageof students selecting thelowIIcategory exceeds thepercentage of students in the high11low'category.In two other segments the highand lopercehtagesare equal.In the remaining 51segments more students foundIII.the material to be of highrather than low interest.Theaverages for all segmentsare:34% of the students found11the materialsto be of high interest; 12% oflow interest; andI-1the remaining 52% thoughtthem to be of average interest.Ii1 \111rl1)11IIi11.39V.SEGMENTS-WITH
46 IN-MEDIA EFFECTIVENESSAs previously disc
IN-MEDIA EFFECTIVENESSAs previously discussed,differences in segmentperformance can be attributedto a multitude of factorssuchas differences in content,test items, media andpresentationforms and the staff whodeveloped the materials.Thus whendifferencei insegment performance arise,the difficultylies in determining thecausative factors.The one factor.which may most easilybe isolated is thatof the mediumemployed.To obtain some estimateof the influence themedium itself hason segment performance,one may averagethe results for materialdeveloped in each mediumand contrastthe averages.This has been dime inTable 10.One important qualificationmust be made in interpretingthe results in Table10.Although the materialshave beengrouped on the basis ofmedia, the results shouldnot beconstrued as evidenceofthe superiorityor inferiority ofone medium vis a vis another.These results do not reflectinherent qualities ofthe media as such, butare rather,.indications of theeffectiveness of the materialswhich were11developed for and presentedin each medium.The reason forgrouping and reportingresults by media is tolocalize thePva
47 riations in effectivenessof materials wh
riations in effectivenessof materials whichmay beIIattributable to teachingvia different media.The results donot indicate comparisonsof media madeover identical contentIwith identicaltest items, developed by thesame writer andemploying identicalpresentation variables. rIn compiling the data for Table 10 it was oftennecessary to use data reported by module rather than bysegment because the segment contained modules developed in4011more than one medium.Progress check performance data inliTable 10 are derived from the figures in Appendix D whichpresent a breakdown of student performance on progress[Ichecks by module. (The research report will offer in-depthanalyses of the presentation and media variables manipulatedIiwithin these modules.)The time and interest data in Table 10ilare similarly tabulated on a "by module" basis.iiI;!Audiotape/IPB1Audiotape Script/IPBAudiotape Script/PanelbookCAII.Linear TextTABLE 10Progress Check Mean Performance (Before RemediatioqMean Student Time, Percentage of Students RatingMaterials as Having High/Low Interest, AveragedAcross All Modules Developed in Each MediumICAI Scr
48 ipt/IPBSyndactic TextAudiotape/Panelbook
ipt/IPBSyndactic TextAudiotape/PanelbookProgressTime% Students RatingCheckInterest LevelPerform-No.anceMins.HighLow9357361093.544478941241188486868855311887476148752388824123141 .41In Table 10 the mediaare ranked, high to low, accordingto teir progress check performance.To assess the relationshipbetween performance and theother three items Spearmanrankorder correlations betweenperformance and time, performanceand high interest, andperformanceand low interest havebeencomputed.The correlational valuesyielded are:.595(performance-time).150(performance-high interest).020(performance-low interest)Although the correlationbetween performance andtime isrelatively high, withan n of 8(8 media) the correlationisnot significantly differentfrom zero.Similarly, theothertwo correlational valuesare not statistically significant. VI.REVISION PROCEDURES FOR COURSE IMPROVEMENTIn Section IV reference is made to the revisionofcourse materials based on empirical data from the secondimplementation.The materials had already undergoneone.......revision cycle before they were testedout in the secondimplementation.During the fir
49 st revision cycle theextantmaterials wer
st revision cycle theextantmaterials were improved considerably (as shownin Table 9,page34, average performance increased from 78% to 86%),two media were dropped and twonew ones added.As explicated in the Phase I EvaluationReport, thedecision was made to omit two media- videotape/panelbooksand learning activity summaries- and, to replace them by(audiotape panelbooks and syndactic texts,:respectively.The media which had performed best duringthe first421,1implementation were computer assistedinstruction (CAI) andn audiotape/intrinsically programed booklet (AT/IPB).Toliascertain if the .segments developed inthese media performed11 well primarily because of the hardware they employed, itwasdecided to prepare parallelpaper versions of these segmentsand to offer themas media options to the hardware-concentratedI*modules.Thus was born module S in Segments 4.4- 4.7(AT script/IPB) and in 12.1- 12.4 (CAI script/IPB).ReferringIto Appendix D,.the reader willsee that average performanceon module S did not vary much fromaverage performance on1the modules using audiotapesor CAI. 143The first revisioncycle therefore e
50 ntailedrevisionof most segments andthe d
ntailedrevisionof most segments andthe development ofsome segments in newmedia presentations, eitheras substitutes for media whichwere deleted or as additionsto the current mediaselection.The secondrevision cycle(which followed thesecondimplementation of the course)was somewhat different fromthe first in that:(1) revision tomaterials was orientedtoward improving thosespecific segments andtest items11-which showed lowperformance rather thanthe more globalupgrading of all thecourse materials which tookplace duringthe first revision; (2)a new element was added,namelyrevision of thecontent outline; and (3)the step towarddeveloping a hardware-freeversion of allcore content wascompleted by developinga syndactic text option forallaudiotape/panelbooksegments.These three aspects ofthe. second revision cycle are discussed inthis section undertwoheadings whichseparate them into revisionactivities basedeither on hard dataor on subjective professionaljudgement.A.Use of Effectiveness DataOf the 59core segments, 20 were identified(see Table 6,page 28) as needing improvementon the basis that they failedto meet the mos
51 tstringent criterion levelof performance
tstringent criterion levelof performancewhereby 80% of thestudents would correctlyanswer 800 of theprogress check test itemson the first try.These segmentswere examined by WLC writersand subject matterexperts whorevised material withwhich the students hadexperienceddifficulty.Examples used asconcrete illustrations of1 44principles were sharpened, and theprogress check items weremodified by altering the stem toremove any ambiguities and/or-altering the responses so that thecorrect response moreclosely corresponded to whatwas taught in the materials.Likewise, the distractors which had drawnmany responses wereexamined and modified.In addition to using their professionalexpertise tohone the quality of theinstructional materials, the WLCpersonnel used computer printouts ofprogress check test itemanalyses to guide them in the revisionprocess.The printoutslisted the number and percentageof students who had selectedeach response to each itemon the progress checks both beforeand after remediation.This data provideda clear picture ofwhich objectiveswere misunderstood on the first attempt butwere grasped after re
52 mediation (indicatingthat perhaps thetes
mediation (indicatingthat perhaps thetest item or a particular aspect of teachingthe objectiveneeded revision), and whichobjectives were not attainedeither before or after remediationby many students (revealingmost likely that instruc:-.ionon the entire objective shouldbe clarified or amplified,.Furthermore, data from the test itemanalyses were usedas a basis for revising all test items whichwere not correctlyanswered by 80% of the.studentson the first try whether ornot the progress check belongedto the 20 segments whichwere revised because of failure tomeet the 80-80 criterion. ;I!.Table S (page 27) shows that 76.2%of the test itemswereIcorrectly answered on the firstiteration of theprogresschecks.The remaining 24.8%were modified in light of the1data on the test item analyses.Thus the entire revisionIprocess relied heavily on the empiricaldata from the secondimplementation of thecourse in preparing the materials andIprogress checks in their final form.Mention should be madehere that the administrative1_pre/posttest was not modifiedbefore being given to theIIstudents involved in thethird implementation
53 .In order to revise theadministrative te
.In order to revise theadministrative test, in depthIIanalysis comparingpre and posttest performance fromtheIIfall of 1970run was required to identifyany inadequatetest items.The course wasrun for the third time during1the second semester(Spring) of 197] and thetime intervalof one week betweenthe administration of theposttest toP1the fall of 1970 studentsand the,administration ofthepretest to the spring of1971 students did not permittherequisite analysis.After the pretest had beenadministeredto the thirdgroup of students, analysis ofthedata fromthe secondgroup revealed a number oftest items, (seeTable 3,page 23) on which performancewas poor. 'Beforeadministering theposttest to the thirdgroup of students,the above-mentioneditems will be analyzedto determinewhether they shouldbe excluded from theposttest.(11I451I11 46The empirical results of thesecond implementationalso served as the foundation forwhat was ultimatelyasubjective decision on the mediaselections to be incorporatedin the final production ofcourse materials.Data from thefirst implementation had revealedthat segments developedin vidcotape/pane
54 lbook andlearning activitysummary modesh
lbook andlearning activitysummary modeshad low ,overall performance;these media were dropped fromthe course since effortsto revise them did notseem warranted.1:In a similar fashion, the mediaemployed in the secondimplementation.were evaluated byassessing the effectivenessof the segments developedwithin them.Table 10, page WO,.lists the average effectiveness ofsegments developed in eachof the media- the lowest average performanceoccurs in the11audiotape/panelbook segments wherethe mean performanceribefore remodiation is 821which, although it is thelowestscore, still exceeds the 80% which WIC set as the minimumlevel of acceptable performance.:.The 20 segments which didnot meet the 80%-80% criterion!on the first iteration (Table 6,page28 ) are grouped bymedia in Table 11 to yielda clearer 'picture of possible media1Iinfluence on poor performanceon some segments. le,47Table 11Identification by Media of the20 SegmentsNot Meeting the 801480%Criterion,First Iteration (ReferenceTable 6, page 28)Audiotape/LinearSyndacticPanelbookTextTextSegmentsSegmentsSegmentsCAI.Segments2.35.95.42.612.22.47.1S.S2.712.43.17.35
55 .65.23.27.48.63.37.511.1Because half of
.65.23.27.48.63.37.511.1Because half of the 20segments which performedpoorlymere developed in the medium ofaudiotape/panelbook (AT/PB),the possibility ofeliminating this medium altogetherwasconsidered.However, since overallperformance on thismedium was atan acceptable level (82%), the decisionwasmade to retain itand to give attentionto optimizing theeffectiveness of the mediumper se in all AT/PB segmentsaswell as to subjectingthe specific 10segments to thestandard revisionprocess.Since instruction inthe AT/PBmedium is so heavilyoriented toward auraldelivery,attention was givento stylistic and deliveryvariables aswell as to contentitself.WLC recognized the basicdifferences betweenwritten and auditorypresentations andtook pains to revisethe impact of theauditory style ofinstruction.This entailed rephrasingof the audiotapescripts and retapingeach of the 19 AT/PBsegments.The 48panelbooks which were usedas an adjunct to the tapedlectureswere left virtually unchanged.B.Subjective Evaluation.WLC concurred with the USNA'ssuggestion to renderimplementation of thecourse more flexible by deliveringapaper version
56 to parallelevery core segment tied tohar
to parallelevery core segment tied tohardware.The syndactic text mode ofpresentation wasselected to carry thepaper version.of the AT/PBsegmentsbecause syndactic text isessentially a linear programedtext which incorporatesan additional element ofmanagementin the guise of thesummary and summary quiz.A majoreffort, therefore, in thesecond revision cyclewas th'.1generation of parallel syndactictexts for the 19 AT/PBsegments.In "syndacticizing" thesesegments, the writer dividedan audiotape script into approximatelythree major contentareas and wrote a summary for eacharea.A summary quizwasthen developed tomeasure comprehension of the contentpresented in thesummary.The next step was thegenerationof linear framesto be used as remediation bythe studentwho did not correctlyanswer all questions on thesummaryquiz.The linear frames taughtessentially the same contentas the summary but providedinstruction in smallerstepsand frequentlysupplemented the instructionwith examples.Portions of the panelbook,such as'diagrams andcharts, wereincluded in the syndactictext where they were essentialto4 49instruction.Many pictures
57 and illustrations inthepanelbook were e
and illustrations inthepanelbook were eliminated from the syndactictext whentheir presence was not requisiteto the learning ofthe material.Subjective evaluation of content, withregard to11had been developed alonga spiral or helical structure.appropriateness and level of specificitybecame a majorarea of concern during thisfinal revision.It was thepoint of view of the contractor thatthe content outlineThis pattern of organizationsuggests that complex notions.are 1 -)st taught in recurring cycles which allowthelearner to look at many facets of thesame concept.SpecificallyOnstructional material dealingwith communicationshould not be relegated to thatsection entitled InterpersonalCommunication!-, but should be reintroducedas it relates toother areas of content suchas Morale, or Sehior SubordinateRelations.According to the logic of the spiralconstructa chart or graph which servesa specific purpose in onechapter can be purposely introducedagain in another sectionto focus on another aspect of the issuerepresented.Itwas unfortunate that this approachwas deemed by the customerto cause redundancy.Indeed, the que
58 stion of redundancyand necessary changes
stion of redundancyand necessary changes to thecontent outline was a clearconflict of views.The data compiled by thecontractorindicated not onlya high student interest level in thematerials, but additionally, inresponse to question 7 50on the Module Questionnaire asking, "Did you feel thatthere were any sections of the materials thatwereunduly repetitious?," a mean of 93.8% ofall students.answering this question replied in the negative.Therefore,it was with a great deal of reluctance that thecontractorshared the.efforts in deleting previouslyagreed uponfmaterials from the content outline.The scope of this effort entailed there-examinationof the skeletal framework of eachsegment, and the actualrevision of 80% of the segments (32segments were- extensively revised and 14 had minor changes).These11-changes to the content outline necessitatedcorrespondingifrLalterations to materials and test items. PART ONE:Segment ISegment IIPART TWO:Segment ISegment IISegment IIISegment IVSegment VSegment VISegment VIISegment VIIISegment IXPART THREE:Segment ISegment IISegment IIISegment IV'Segment VPART FOUR:Segment ISeg
59 ment IISegment IIISegment IVSegment VSeg
ment IISegment IIISegment IVSegment VSegment VISegment VIIPART FIVE:SegmentSegment IISegment IIISegment IVSegment V.Segment VISegment VIISegment VIIISegment IXSegment XAPPENDIX ACOURSE OUTLINE.Overview of LeadershipConcepts of LeadershipStandards of Leadership in theIndividual BehaviorIntroduction to PsychologyBehavior and Its ObservationLearningFactors Affecting LearningAttention. and PerceptionMotivationConflictNeurotic and Psychotic ReactionsPersonalityNaval ServiceGroup DynamicsCharacteristics of GroupsThe Relation of the Leaderto the GroupGroup InteractionsConformity as a Factor of Group BehaviorRelation of the Individual to the GroupAchieving Effective CommunicationImportance of Interpersonal CommunicationTypes of CommunicationThe Communication Process (Receiver andBarriers)The Communication Process (Sender andFeedback)Formal Communication and Its DimensionsInformal CommunicationCommunication Under Battle SituationsMilitary ManagementIntroduction to Management and the ManagementProcessDecision Making and CreativityObjectivesPlanningOrganizing:Principles and ProcessOrganizing:StructureOrganizing:C
60 hartingDirectingControllingCoordinating
hartingDirectingControllingCoordinating PART SIX:Authority and ResponsibilityConcept of AuthorityWhy People Accept/Resist AuthorityDelegation of Authority; Line-Staff RelationshipResponsibilitySegment ISegment IISegment IIISegment IVPART SEVEN:Segment ISegment IISegment IIISegment IVSegment VPART EIGHT:Segment ISegment IISegment IIISegment IVSegment VSegment VIPART NINE:Segment ISegment IIPART TEN:Segment ISegment IIJGAPPENDIXAContinuedLeadership Behavior and StyleLeadership BehaviorLeadership StyleDeterminers of Leadership Style- The LeaderDeterminers of Leadership Style- The Group and The SituationParticipative LeadershipSenior-Subordinate RelationshipsOrganizational Structure & Social Distancein Senior-Subordinate RelationshipsOfficer-Enlisted RelationshipsAssumption of Command and Formal & Informal LeaderRelationshipsIntroduction to CounselingThe Counseling ProcessRelations with Seniors and ContemporariesMorale - Esprit de CorpsMoraleGroup Solidarity and EspritDisciplineIntroduction to DisciplineDevelopment and Maintenance of DisciplinePART ELEVEN:Segment ISegment I)Segment IIIPART TWELVE:Segment I
61 Segment IISegment IIISegment IVPersonnel
Segment IISegment IIISegment IVPersonnel EvaluationThe Role of EvaluationEnlisted Performance EvaluationOfficer EvaluationApplied LeadershipMeasurement of Effective LeadershipGenerally Recognized CharacteristicsTechniques of Assuming Command"That's an Order!"of an Effective Leader Ii.IPRESENTATION DESIGNFALL OF 1970 IMPLEMENTATION53APPENDIXB ir"W'eMamemeamMoOMMranore,traMYrIMMOM.MM^MOrMaMalle,...M.WITIVIM.r..10111.011110.1100.3.1Svndactictextr---V12.6.1SyndaettetextReeled-I Prog.Seq.2.6.2SyndacttctextRemed-Pet.Sum.2.6.32.8.3ISyndactici textSyrflIt'CLtextSyndactictextllPened-Remed-Remed-Su?marySUMTrySumnary..-- ---.1.2Dlscussi)Booklet2.7.1SyndactictextRemed-Prog.Seq.2.7.2SyndactictextRemed-Det.Sum.rOdimaiim4bebigitiWil.1.11414a11144SyndactictextRAFPao2.1.2.ANWQ04AT/P11HRDF'ConfirmOvertHRDPConfirmOvertlairdHRDFConfirmOvert1IPSNUDEConfirmOvert.1.1.101.012.2.22.4.22.5.2SyndacticAT/PBAT/PSAT/PSAT/PStextLRDFLRDFLRDFLRDFRAF4o confirmNo confirmNo confirmNo confirmNo mapOvertOvertOvertOvert2.1.32.2.7SyndacticAT /PBtextLRDFNo RAFConfirmMapCovert2.1.4SyndactictextNo RAFNo map2.8.1SyndactictextRemed-Prog.Seq.2.4.7
62 2.5.7AT/P11LIIDFConfirmCovertAT/PSLRDFCo
2.5.7AT/P11LIIDFConfirmCovertAT/PSLRDFConfirmCovert2.2.82.4.82.5.8AT/PBAT/PSAT/PMMRDFIIRDFIIRDFNo confirmNa confirmNo confirmCovertCovertCovert2.8.1SyndacticaxtMap3.1.1AT/PSHRDFConfirmOvert3.2.1AT/PSNRDFConfirmOvertAT/PSIIRDFNo confirmCovert2.8.2SyndactictextRemed-Det.Sum.2.9.2SyndactictextRAF4o nap2.9.3SyndactictextNo RAFMap3.1.23.2.2AT /PBAT/PSLRDFLRDFNo confirmNo confirmOvertOvert3.1.7AT /PBLRDFConfirmCovert3.2.7AT/PSLRDFConfirmCovert2.9.43.1.83.2.8SyndacticAT/PBAT/PStextIIRDFIIRDFNo RAFNo confirmNo confirmNo mapCovertCovertAT/IPAudiotape/Intrinsic ProgramCATS /1PComputer Assisted InstructionIIRDFHigh Response Demand FrequencyATS/IPAudtotape Script/Intrinsic ProgramScript/Intrinsic ProgramLMFLow Management FrequencyAT /P:.Audtotape/PanelbookCPTCumulative PosttestLRDFLow Response Demand FrequencyATS /PBAudiotape Script/PanelbookConfirmConfirmationMMF.Medium Management FrequencyCAIConputer Assisted Instruction!IMF..High Management FrequencyRAF.Revealed Answer ForsCeasedRemediationOProgress CheckCR 1.3.13.4.13.5.1AT/PBSyndacticHNDFHRDFtextHRDFConfirmConfirmRAFOvert-OvertOvertMapselectedMO-vertOvett-J..
63 .1240.114.1.2Lancer text1.3.2AT/PB!ADP -
.1240.114.1.2Lancer text1.3.2AT/PB!ADP -No confirmChen3.3.1AT/PIILRDVConfirmCoverti3.3.sAT /PB.TRUE'No confirmCovert4.4.1AT//PHRDFmmr4.4.2AT/1PHRDF!IMF4.4.3AT/IPHRPFLMF4.4.4IAT/IPLRDrLFATS/IPDROP,mr3.4.2AT/PBLIMPNo confirmOvertAT/PBLR9FConfirmCovert1.4.8AT/PBHRDFNo confirmCovert4.5.1AT/IPHRDFHMF4.6.1AT/1PIIROFTGIF3.5.2SyndactictextRAFNo map3.5.3SyndactictextNo RAFMap4.2.24.3.2Linear texLinear textHRDFHRDFOvert-Overt-selectedselected4.2.3Linear texHOFCovert4.1.4W4.2.4Linear textLRDFOvert-underlineLinear textLRDFOvert-underline4.3.4Linear textLRDFOvert-underline3.5.44.1.54.2.54.3.SSyndacticLinear textLinear textLinear texttextLAUF!ADPLRDFNo RAFOvert-Overt-Overt-No napselectedselectedselected4.5.24.1.1AT//P"SDPHMF4.1.64.2.64.3.6Linear textLinear textLinear textLRDF!ADPLRDr.CovertCovertCovert4.6.24.1.2AT/1PAT/IPAT//PHRDFHRDFHRDFmmr!!VFMMF4.5.14.6.34.7.3AT/IPHRDFAT/IPAT/IPLRDFnorLMFLMF4.5.44.6.4AT/1PLRDFLMTAT/IPLRDFLMF4.1.4AT/1PLRDFLMF4.5.5ATS/IPHoDr1.44.6.SATS/IPfiRDFIDI I4.1.SATS/IPHMF5.1.15.2.1SyndacticSyndactictexttentMapYapS.1.2SyndacticSyndacticSyndactictextNo map.SrteatmapNo map5.3.1.SyndactictertMap
64 5.2.25.3.20fDtZ CPT 65.10.3AT/PELRDFConf
5.2.25.3.20fDtZ CPT 65.10.3AT/PELRDFConfirnOvert15.10.4L7/PE!ADFgo confirm.vert,5.t0.5`AI/P8ORDFConfirm,Covert, 5.0.61; /Pt.RoF.oconfirm"evertSM.66.01.6.6r4t.trair.qM7v,..6.9......nernsmn.aleimmtveopienoviesarreePliierfirtvieeZ.m.O.V.VV...^,e"."'.--"ttft-----J:::::1r.::::17.7--1=7:1.:::::1=1:::::1!!!=IIRDFMOPm5:::.5/5.5.35.6.3.5.7.45.1.4AT/IS89.41/Linear textLinear textLinear texCD..-underlineOvert-ltgrline(Overt-LinearLineariE3etg1.51,3rmAT /p,/selectedselectedselectedOvertOvertOvertCoverteFr t4.4 41InD F0+41A4T90/DcrF150nfirm44NIAIToltp/cFPon3firm.NoCoveOvertOvertOvertNo confirle/.0F52::-.410AZt.KT:"AT /PDAT /PEAT /PE%Overt-Linear textAnear text.selected5.4.6Overt-LRDFLinear textselected5.5.6Linear textOvert-LRDFLinear textselected5.6.6AT/PELRDFNoconfirmCovertNWATgliCovertNoconfirmCovertNo confirmunderlineunderlineunderlineCovertCovertCovert%5.4.55.5.55.6.55.7.65.6.6S.9 6LRDFLAUFLRDFCovertCovertCovertiemanivi6.4.1SyndactictextRAFSyndacticSyndacticHaptext//Sexed-SyndacticProg.Seq.Prog.Seq.R:::td-Prog.Seq./6.1.16.2.16.3.1400ttextSyndactictextSyndacticjimAtemed-DyndacticRened-Det.Sum.texttext11111, WDet
65 .Sum.texttextSyndacticReeled-Det.Sum.Ren
.Sum.texttextSyndacticReeled-Det.Sum.Renedtoned-RemedSummrySummarySummaraSyndactictextRAFNo nap////A%%%0%%%0 ":-�0 -Oa6.4.3SyndactictextNo RAFRap6.4.4SyndactictextNo RAFNo naptrt imaaneellrft:=1Line&HRDFOvert.underline1ten.-9RDFOVertunderline7.2.37.3.3AT/111LRDFConfirmOvert7.4.3AT/PLRDFConfirmOvert7.9.1.1.2Linear tenLinear tenAT/PHOFHOFMapOvert-Overt-selectedselectedRDFof confirmvercAT/P8HRDFNo confirmOvert7.3.4AT/PBHRDFNo confirmOvert7.4.4AT/P8IIRDFNo confirmOvert;7.1.5a/11I4DF:onfirm:overt17.1.67.2.5AT/PSHRDFCnn:IrnCovertAT/P8HRDFConfirmCovert7.4.SAT PbHRDFConfirmCovert7.3.23.1.3.2.3AT/PSLinear tenLinear tenNo map9RDF9RDFCovertCovertI1/III/I, o"I7.S.3ATS/PMap.1.4W.2.4ear tex/inear tenrtRDPvet.7.2.6riesAT/I91tOFLRDF)iconfirmNo confirmrvertCovertLRDFNo confirmCovert7.4.6AT /1'bLRDFNo confirmCovertI3.2.6111.3.1near tea.ert.nderline18.3.2near texDFert.elected1.3.33.4.1Syntacticnear texDitext%ertMap8.3.4rear texDFSyndacticvrt=textn'derlineNo map8.4.2near totDIV'1'tOected3.'5;6near text;%ert.9.1.6.1" SyntacticSyntactictexttextMapMop.3.25.6.2SyntacticSyntactictexttNo mapNo mapLinear tenLRDFCovert9.1.
66 1873/PMap10.1.2AT/PMap9.1.3srs/raNo map9
1873/PMap10.1.2AT/PMap9.1.3srs/raNo map9.1.4AT/PNo mapCPT 129.2.1ATS/PMap9.2.2AT/PMap/(near textRDFovert9.2.3'1ATS/PSS0 "�CNo Nap%rt. r9.2.4Fa*AT/PS%:: 0-4No nap0 )4esbCf..n MIMMENVMMMIVartSVMM n'n'rCTS7A AVM.PYMPG.Tent:MVWWWWLATS/ZPMap141110011110.1.110.2.1ATS/IPMap!imam:4--ealmataangm-.,10CA!MROFIMF20.1.210.2.2SyndactictextRemed-Prop.Seq.11.2.111.3.1SyndactictextRemed-Prog.S414.Syndactictextgamed.Prop.Seq.12.2.2MRDF!0.!FCA11AT/IPMapAT/IPMap10.2.310.2.3ATS/IPNo mapSyndactictextHeftedPet.Sum.11.2.2SyndactictextReneDet.Sum.11.3.2SyndactictextSealed.Det.Sum.12.1.3CAIDROPLMFItI/1/I ,IATS/IPNo map20.1.4AT/1PNo map10.2.4AT/1PNo nap12.1.3SyndactictextResod.Summary11.2.3Syndact ctextgamed.SummarySyndact ctextReneSummary12.1.4CA!LRDFLMF12.2.1CA!HROFM4F12.2.2CAIMRDFMMF12.2.3CA!MRDFLME12.2.4CA!LPDFIMF12.2.5ICA1S/IPRDI114r12.3.1.12.4.1CAIHROFimr12.4.2CAIURDF!MF12.4.3CA!MRDFLMF12.3.5In til12.4.4CAILRDFLMFCATS/11IMFINF01111.MID411110%NP.P.12.1.5CAIS/IPP.ORD?IMF.0r+C0 1.1APPENDIX Cinto (minutes) spent on the material excluding the instructionsand progress cheekFor the following questions circle the vproi»iate
67 number.1.Was the material interesting?]![number.1.Was the material interesting?]](884355/number-1-was-the-material-interesting-as.jpg "number.1.Was the material interesting?]")
number.1.Was the material interesting?]as the material difficult?I ate your approval of the way thei..ateria.1 was presented (i.e.syndactic text, audiotape, etc.)I..;anypOinis were illustrated by.military examples. Rate your-3sessment of their instructional.ffeetiVeneSS..IlihAboveAvre.....An.Below_Avg!Low1.23451234.. 5..12345..12345TooAboutToo.....ManyItt121Fewti.tflow did you feel about the123irantity of miiitory excmplis.used?..pit you feel that there were any sections of the materialsthat were unduly repetitious ?if you answered yes to the above question, pleasespecify the seetion(s) by page nurvber.btiyou have any additional statements to make aboutany of the above questions, please write440 question number and make your comment here.*Il'.*01that suggestions. wouldyou have for improving this segment? 1111ItI',riAPPENDIX DMean Progress CheckPerformance(Before Remediation)By Module StudiedAudiotape/Intrinsically ProgramedBookletAudiotape Script/IntrinsicallyProgramed BookletSegmentTotalMod. 1Mod. 2Mod. 3Mod. 4Mod. 5NumberSegmentTapeTapeTapeTapeScriptPerform-HRDFHRDFHRDFLRDFHRDFanceHMFMMFLMFLMFHMF4.4
68 9596949896914.59597979094964.69090909284
9596949896914.59597979094964.69090909284914.7909290919089Mean939493939192Mean for all tape modules= 93Mean for all scriptmodules = 92Computer Assisted Instruction(CAI)CAI Script/IntrinsicallyProgramed Booklet1RSegmentTotalMod. 1Mod.Mod. 3Mod. 4Mod. 5Segment2,NumberSegmentCAI4TA1CAICAIScript/IPBPerform-HRDFHRDFHRDFLRDFHRDFanceHMFMMFLMFLMFHMF12.193939095939612.28281838185.7812.393979189099212.4838781788582Mean889086869087IIMean for all CAI modules= 88Mean for all CAI scriptmodules = 87T..60 It61APPENDIX DContinuedAudiotape/Intrinsically ProgramedBookletAudiotape Script /IntrinsicallyProgramed BookletSegmentTotalNumberSegmentPerformanceMod. .1Mod. 2Mod. 3ScriptTapeScriptContentContentNo ContentMapMapMapMod. 4TapeNo ContentMap10.1959393999610.29190938895Mean9392939496Mean for all tape modules= 95Mean for all script modules= 93Mean for all moduleswith content maps= 93Mean for all moduleswithout contentmaps = 95Audiotape/PanelbookAudiotape Script/PanelbookSegmentTotalMod. 1Mod. 2Mod. 3NumberSegmentTapeTapeScriptPerformanceContentNoContentMapContentMapMap7.59.2ilMeanMean for all tape modules= 8911Mean for all
69 scriptmodules = 89Mean for all modules
scriptmodules = 89Mean for all modules withcontent maps = 89I"Mean for all moduleswithout contentmaps = 88i.Mod. 4ScriptNoContentMap8380848583919391928991929292888888899087 F62APPENDIX DContinuedAudiotape/PanelbookSeg.TotalMod.lMod.2Mod.3No.Seg.HRDFLRDFLRDFPerf.Conf.NoConf.OvertConf.OvertOvertMod.4HRDFNoCont.OvertMod.SMod.6Mod.7' Mod.8HRDFLRDFLRDFHRDFConf.NoConf.NoCovert Conf.Covert Conf.CovertCovert2.286938576852.37073696S722.478787778802.S90888893913.173757375693.280778477793.370727369683.487858888885.783.848085858.890938893885.9797187.82755.109090'8891927.181848379787.287'868692857.380797985797.47873808180Mean81808083848683.7879Mean for all HRDF modules= 82Mean for all LRDF modules= 81Mean for all modules havingconfirmation . 82Mean for all modules havingno confirmation = 82Mean for all modules withovert response . 82Mean for all module3 withcovert response . 82 APPENDIX DContinuedSyndactic TextSegmentNumberTotalSegmentPerformanceMod..1Remed.ProgramSequenceMod. 2Remed.DetailedSummaryMod. 3Remed.Summary2.6827880852.7727668742.8868685886.190'9388906.2858986806.38888889011.18285818011.29395939011.3909
70 58887Mean85878485SegmentNumberSyndactic
58887Mean85878485SegmentNumberSyndactic Text(Remed.Programed Sequence)TotalSegmentPerformanceMod. 1MapMod. 2No Map5.18989895.2767775.......f-..--5.39293908.49493958.58786888.687888SMean888887k t.)4APPENDIX D.ContinuedSyndactic Texts(Remed.Programed Sequence)SegmentNumberTotalSegmentPerformanceMod.RAFMap1Mod. 2RAFNo MapMod. 3No RAFMapMod. 4No RAFNo Map2.18888878,8'862.990908692903.5.93949395926.48790878588Mean9091889089Mean for all modules with RAF's= 90Mean for all modules without RAF's= 90Mean for all modules with contentmaps = 91Mean for all modules withoutcontent maps = 89Map=Content MapRAF=RevealedAnswer FormLinear TextsSegmentNumberTotalSegmentPerform-anceMod. 1HRDFOvertUnder-lineMod. 2HRDFOvertSelectedMod. 3HRDFCovertMod. 4LRDFOvertUnder-lineMod. 5LRDFOvertSelectedMod. 6LRDFCovert4.192959184.9893934.2959994969394944.3848584878583835.4848384867787855.5827989807880845.6828684837880838.1878983908786888.2919191-939190938.392969685919488Mean88898887868788Mean for all HRDF modules ='88Mean for all LRDF modules= 87IMean for all overt-underlinemodules = 88Mean for all overt-selectedmodules = 88111 r, n.n