
INDICATORS IN KENYA Presentation to participants on development of nationalregional biodiversity related indicators BY R ODONGO Oluochkwsgoke Introductionoverview Some national biodivers ID: 837801
Download Pdf The PPT/PDF document "DEVELOPMENT OF BIODIVERSITY" is the property of its rightful owner. Permission is granted to download and print the materials on this web site for personal, non-commercial use only, and to display it on your personal computer provided you do not modify the materials and that you retain all copyright notices contained in the materials. By downloading content from our website, you accept the terms of this agreement.


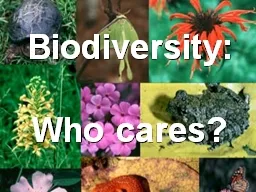


1 DEVELOPMENT OF BIODIVERSITY INDICATORS
DEVELOPMENT OF BIODIVERSITY INDICATORS IN KENYA Presentation to participants on development of national/regional biodiversity related indicators BY R. ODONGO Oluoch@kws.go.ke Introduction/overview • Some national biodiversity policies and targets • Example of some biodiversity indicators developed in Kenya • Experiences during the development • Some successes in biodiversity indicators development • Communication and use of biodiversity indicators • Conclusion and recommendations National Biodiversity Policies and Targets •
2 Achieve by 2010 a significant reduction
Achieve by 2010 a significant reduction of the current rate of biodiversity loss • The National Environmental Action Plan (NEAP), the plan emphasises the need to monitor environmental change for effective management of biodiversity. • The Environmental Management and Coordination Act (EMCA) commits the government to undertake effective environmental management, monitoring and reporting. • Biodiversity indicators has been adopted to be used for reporting on the state of the environment. • National Sustainable Development and Poverty
3 Reduction Strategy Paper provide for
Reduction Strategy Paper provide for monitoring of ecosystem services that affect production sector • Millennium development goals that Kenya should meet. Indicators could be used to measure the state of the human environment • Adherence to MEAs Developing biodiversity indicators • Biodiversity Indicators for national use (BINU) • Biodiversity international project – Biodiversity and poverty linkages – Estimating the quality of key ecosystems in Kenya • Others that contribute to indicators development – Lake Victoria environme
4 ntal management programme (LVEMP) – Ou
–
Ou")
ntal management programme (LVEMP) – Outlook Africa – State of environment report ( NEMA) – National Monitoring programmes – state of parks National consultation • The stakeholders for biodiversity management in each sector are identified – referred to as lead agencies • Identification of processes, functions and individuals that may fit into a indicator development process. • Provide incentives and enhance interest in biodiversity indicators, that promote stakeholder willingness to participate • Identification of common a
5 reas of concern, - which questions are
reas of concern, - which questions are asked by individuals, communities and the government that need answers • Linking indicators with targets to ensure each player has a stake • Selecting themes for reporting to ensure stakeholder feedback • Initiating dialogue at different levels to institutionalize findings, - targeting resource users, policy managers, managers and researchers Experience from National consultation • Some stakeholders are only interested in the outcomes and not the process • It is easy to identify stakeholders, b
6 ut difficult to maintain their participa
ut difficult to maintain their participation • Different levels and types of stakeholders require different approaches and forums to involve them. • It is more difficult to involve stakeholders from the private sector than those from natural resources sectors • It is important to allocate time to explain key concepts like biological diversity, indicators, NCI, importance of indicators and scales of interests. • Education and awareness are important and continuous process during biodiversity indicator development. • It is more app
7 ropriate hold consultations for each cat
ropriate hold consultations for each category of stakeholder so as to reach the full range of stakeholders. • Communication and information dissemination (reporting of progress) to institutions is critical for maintaining the participation of key institutions. What are the questions • The diversity and complexity of stakeholders make it difficult to know which questions to answer • The list of questions, targets and issues can be obtained through workshops • Application of a framework such as DPSIR help categorize and organize issues
8 • Identify the headline answers impor
• Identify the headline answers important to stakeholders • select questions that can be easily answered but with the greatest impact Selecting indicators • Mapping indicators to key questions - this focused the scope of and reduced the number of indicators • Mapping data sets to key questions – can the data adequately answer the question? • Mapping the indicators to the data set – does the data set represent the indicator – it could be explicit or implicit • How attractive /charismatic/ distinctive are the indicators
9 (effectiveness) • The indicators shou
•
The indicators shou")
(effectiveness) • The indicators should have a long term monitoring programme • National reporting, and queries from leaders also shape the indicator selection Some effective Indicators • Large mammal population trend in Masai Mara - decline in numbers due to rapid tourism development and settlement – effect - suspension of further tourism developments and the development of tourism plan • CPUE – indicator for L. Victorian and Naivasha – Effect - closed fishing season for fish stock recovery • Encroachment in Mt. Kenya,
10 – - expansion of protected area Other
– - expansion of protected area Other indicators not so effective • Loss of forest cover in Mau forest – there was no link to livelihoods. The institution involved was not very responsive to information from external sources. Overview of methodology L. Nakuru Yala Swamp Tana River L. Naivasha Saline and alkaline lakes of R.Valley Region Fresh water swamps and marshes Fresh water lakes National Riverine ecosystems Biodiversity indicators Inland wetlands of Kenya National GIS Layers (Wetlands, agriculture, forests, landuse) S
11 caling up Scaling up Scaling up Scaling
caling up Scaling up Scaling up Scaling up Dissemination, communication and use • Involvement of large number of stakeholders increases the rate of dissemination. • Providing feedback and answers to the questions asked by institutions and leaders • Identifying impacts that generate interest and communicating them to institutions • Maintaining the indicator development work for longer periods. • Linking indicators to monitoring programmes, hence providing meaning to the programmes • Institutionalize the indicator development progra
12 mmes similar to monitoring programmes.
mmes similar to monitoring programmes. • Involve recognized personalities to champion the findings of the indicators Conclusion • Development of indicators has improve Kenyan institutions ability to work with monitoring data to develop indicators • Indicator development has had impact in policy and decision making process through effective reporting • Indicators provide opportunity to discuss with stakeholders options available to mitigate on the threats • Indicators should have a link to human well being to have greater impact