
The Question How do different types of geomagnetic storms change the ion outflow from Earth During a solar storm a massive amount of plasma is ejected into space as magnetic field lines within the sun rearrange bend and break ID: 1023011
Download Presentation The PPT/PDF document "Geomagnetic Storms and Ion Outflow" is the property of its rightful owner. Permission is granted to download and print the materials on this web site for personal, non-commercial use only, and to display it on your personal computer provided you do not modify the materials and that you retain all copyright notices contained in the materials. By downloading content from our website, you accept the terms of this agreement.


1. Geomagnetic Storms and Ion Outflow
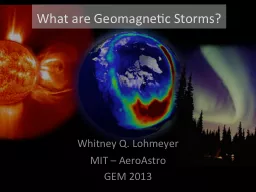
2. The Question: How do different types of geomagnetic storms change the ion outflow from Earth?
3. During a solar storm, a massive amount of plasma is ejected into space as magnetic field lines within the sun rearrange, bend, and break.The plasma carries a magnetic field that may be in the opposite direction to the magnetic field of the earth
4. This drives energy into the ionosphere, allowing for ion outflow to space and potentially changes the atmosphere over long periods of time.These events are called geomagnetic storms, and the drivers for these vents are often categorized as CMEs (coronal mass ejections) or SIRs (stream interaction regions). Image credit: NASA’s Scientific Visualization Studio
5. This team is focused on finding how the ion outflow varies for different kinds of geomagnetic storms.We use data from the FAST satellite to observe a full solar cycle of eleven years, allowing us to analyze various attributes of each storm and eventually learn more about the long-lasting effects of ion escape in the atmosphere, and therefore the habitability of a planet.
6. DstIndexT i m eThe Dst Index is the “Disturbance Storm Time” Index, which is a measure of magnetic activity, specifically the electric current (the ring current) strength around Earth Charged particles in the inner magnetosphere cause a current that is in the opposite direction to Earth’s magnetic field, creating a change in the measured Dst Index Here is an example of the Dst index from a storm in 2005Methods
7. DstIndexT i m eThese storms can be broken up into stages:Green = IncreaseBlue = OnsetRed = Minimum DstPink = RecoveryCyan = Long RecoveryMethodsThese 5 stages represent sections of the 3 phases of a storm:Initial Phase = Between Increase and OnsetMain Phase = Between Onset and Min DstRecovery Phase = Between Min Dst and Recovery
8. This is an example of a plot that was created by finding these times Increase: The increase in SW density and pressure, often where the Dst Index begins to rise to the onset timing (sometimes there is no clear point of increase) Onset: The apex of the Dst Index before it drops, as well as Bz dropping off (signifying the magnetic field turning southward), marks the start of the main phase of the stormMinimum Dst: The lowest Dst value Recovery: When the Dst index returns to 1/3 of its original value or -20 nT, whichever is most appropriate Long Recovery: The beginning of the next storm MethodsnTkm/s/cm³nTnTnPA
9. MethodsThe geo storms are classified as either CMEs (coronal mass ejections), in which a mass of particles are ejected quickly from the solar atmosphere, or SIRs (stream interaction regions), during which a fast-moving solar stream overtakes a slower moving one. These classifications are made by matching the events to lists of SIR and CME events in three papers:Properties of interplanetary coronal mass ejections at one AU during 1995-2004 (Jian et al., 2006, pp. 414-432), Properties of stream interactions at one AU during 1995-2004 (Jian et al., 2006, pp. 356-389), and Operational Dst index prediction model based on combination of artificial neural network and empirical model (Park et al., 2021, pp. 21-27).
10. Analysis“Classically shaped” storms have a sharp, uninterrupted increase to onset, drop to their minimum Dst index value immediately, then follow a constant upward trend through to their recoveryThe types of increase (“sudden”, “gradual”, or “no increase”) tell how long between the time of the storm’s increase and its onset The FAST orbit denotes the orbit number closest to the time of the recorded minimum Dst value Data on over 300 storms was collected and organized as seen in the example below
11. ResultsFor further analysis, this data is organized by year and storm type (CME or SIR), and then by strengthModerate = -50 to -99 nTStrong = <-100nT
12. A clear correlation can be seen between the number of CME and SIR events and the sunspot activity during their years.When looking back at the full set of data, we can see that the ratio of stronger storms to moderate storms increases fairly consistently with the sunspot activity (lower at the start of the cycle, highest in the middle, then decreasing significantly towards the end)
13. Going ForwardThe steps towards completing this goal will be:Create a list of geomagnetic storms from 1996-2007Establish the stages for each of the storms on this list Using the data from FAST, measure the average O+ and H+ outflow in the auroral paths, then sort these based on the magnetic local times for the day and night sidesAverage the data through every orbit of all storm phases }These are the steps that have now been completed The long-term goal is to measure how the flux of ionospheric O+ outflow varies through the difference phases of geostorms, on day and nightside aurora regions.
14. Going ForwardThese are examples of what can be done with the data for one storm (K. Zhao et al., 2021)Now, with this storm phase list, we can study all the storms from 1996-2007
15. ConclusionThank you:Dr. Lynn KistlerDr. Laura Peticolas Dr. Niloufar NowrouziDr. Christopher MouikisDr. Eric LundDr. Kai ZhaoEveryone at MACH