
Case Study It is noted that the Cascade COsystem had the lowest overall TEWI rating This type of system has a higher capital cost but is being used where the true cost of COemissions is considere ID: 826489
Download Pdf The PPT/PDF document "prepared by the AIRAH Natural Refrigeran..." is the property of its rightful owner. Permission is granted to download and print the materials on this web site for personal, non-commercial use only, and to display it on your personal computer provided you do not modify the materials and that you retain all copyright notices contained in the materials. By downloading content from our website, you accept the terms of this agreement.


prepared by the AIRAH Natural Refrigeran
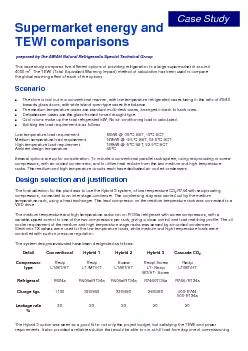
prepared by the AIRAH Natural Refrigerants Special Technical Group This case study compares five different options of providing refrigeration to a large supermarket of around . The TEWI (Total Equivalent Warming Impact) method of calculation has been used to compare Case Study It is noted that the Cascade COsystem had the lowest overall TEWI rating. This type of system has a higher capital cost, but is being used where the true cost of COemissions is considered. The application is well suited for use in warmer climates such as Australia. Further TEWI rating reductions would be achieved if the condensing duty was also using a natural refrigerant (e.g. ammonia ). The calculation and definition of TEWI is as below: TEWI = (GWP x L/100 x n x m
) + (GWP x m xrecovery) + (n
) + (GWP x m xrecovery) + (n x E annual x = Leakage + Recovery losses + Energy Consumption = Direct Emissions + Indirect Emissions GWP= Global Warming Potential L= Leakage rate per year n= system operating life (years) m= Refrigerant charge (kg) recovery= Recycling factor annual =energy consumption per year ( kWh) EmmissionRecovery losses are a measure of the refrigerant that is not recovered at the end of the equipment life. Below are a number of graphs that demonstrate the effectiveness of the Hybrid 3 option. In actual run time the Hybrid 3 option provided the lowest kWh per 24 hours, with 3336 kWh. When measured over an annual period, the Hybrid 3 option p
rovided the lowest kWh at 121,764 kWh us
rovided the lowest kWh at 121,764 kWh usage and also incorporating the direct emissions due to refrigerant leakages, the overall TEWI can be calculated. Graph of TEWI split into indirect and direct portions The indirect calculations for all five options are reasonably close. The conventional system, as expected, is marginally higher. The direct emissions are lower with the Cascade CO system due to the use of the low Global Warming refrigerant and the relative reduction of the higher GWP R134a refrigerant. The direct and indirect TEWI components have been added together and then compared to the baseline conventional R404a system. See below: Graph of combined TEWI results The graph shows the variation from the TEWI baseline, being the R404a c
onventional rack option. conventional sy
onventional rack option. conventional system is shown as 0. uding any recovery losses due to unrecovered refrigerant, is calculated and shown in the graph below. This graph shows the estimated 20-year TEWI variation from the baseline. The 20-year figure graph (above) shows that both the Hybrid 3 option and the Cascade CO emissions as tabulated below. Conventional system R404a Hybrid 1 R404 and R134a Hybrid 2 R404a and R134a R134a Cascade Hybrid 3 COR134a Total TEWI per year Tonnes 2100 1700 1630 1310 1410 Savings Tonnes compared to conventional 0 400 470 790 690 Significant savings in greenhouse gas emissions of approximately 690 to 790 tonnes per year are possible with cost-effective equipment and technologies that are currently availabl