
2 Citizen Acid Rain Monitoring Networks LCCUVM and Audubon Vermont Acid Precipitation Monitoring Program Utility Acid Precipitation Study Program EPRI Operational Evaluation Network Atmospheric Integrated Research Monitoring ID: 918491
Download Presentation The PPT/PDF document "25+ Years of Acid Deposition Monitoring ..." is the property of its rightful owner. Permission is granted to download and print the materials on this web site for personal, non-commercial use only, and to display it on your personal computer provided you do not modify the materials and that you retain all copyright notices contained in the materials. By downloading content from our website, you accept the terms of this agreement.


Slide1
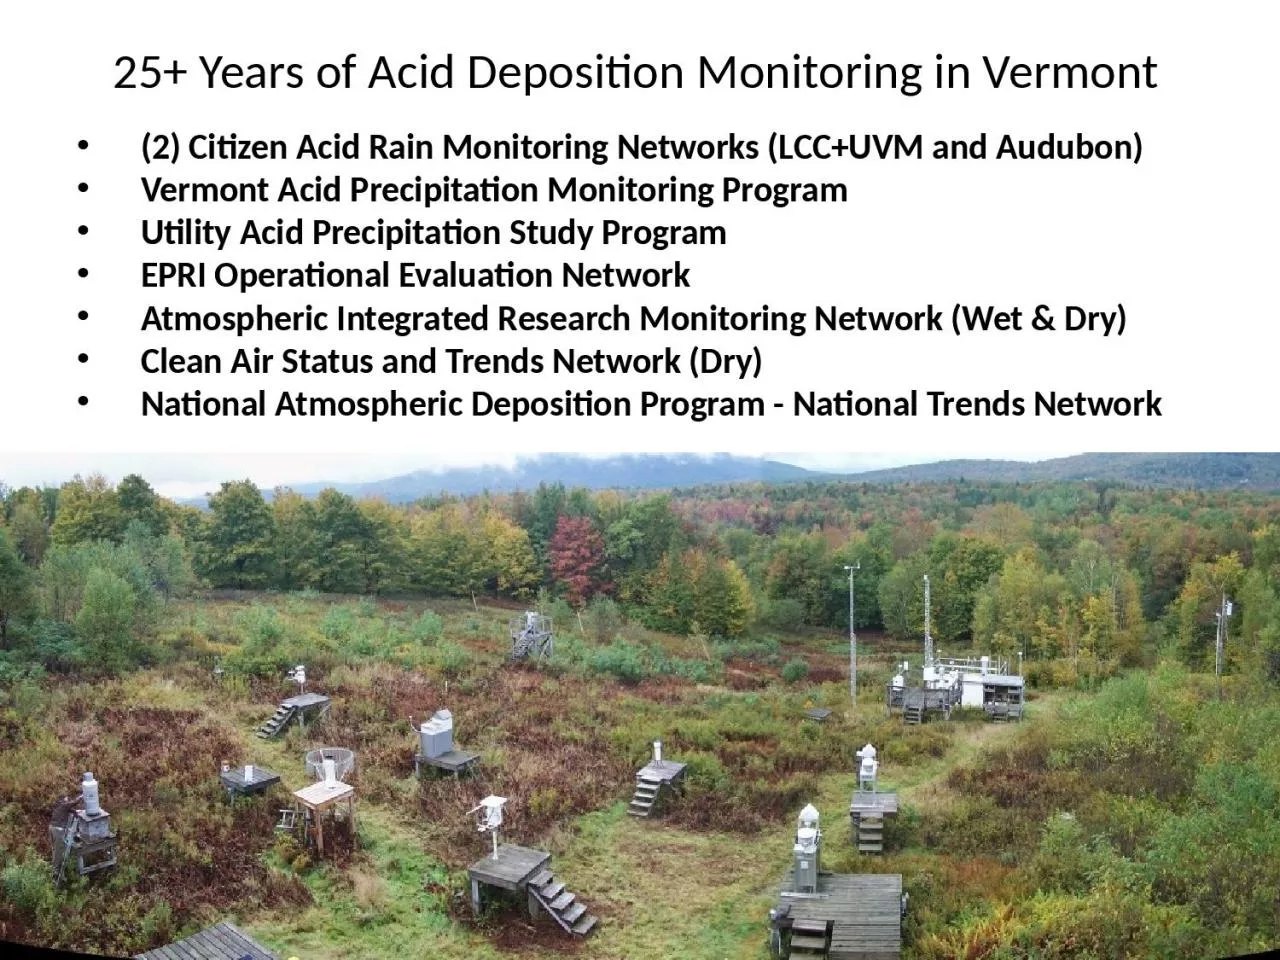
25+ Years of Acid Deposition Monitoring in Vermont
(2) Citizen Acid Rain Monitoring Networks (LCC+UVM and Audubon)
Vermont Acid Precipitation Monitoring Program
Utility Acid Precipitation Study Program
EPRI Operational Evaluation Network
Atmospheric Integrated Research Monitoring
Network (Wet & Dry)
Clean Air Status and Trends Network (Dry)
National Atmospheric Deposition Program - National Trends Network
Slide2National Atmospheric Deposition Program - National Trends
Network
263 Currently Active Sites, Primarily in US, but also Canada, V.I. P.R., Argentina
Slide3Underhill NADP Site VT99
Established 6/12/1984
Bennington NADP Site VT01
Established 4/28/1981
PRISM Model Estimated 2013 Precipitation Amount (Parameter-elevation
Relationships on Independent
Slopes)
Slide4The pH of VT precipitation has increased from
4.3 to 4.4
in the 1980s
To
5.0-5.1
in 2014
An 80% reduction
of acidity in the past 30 years
Slide5Slide6Slide7Slide8NADP Concentrations Combined with PRISM Topo-enhanced
Precip
. Volume to produce Gridded (4 km) Wet S & N Deposition Data
Available 1985-2014
CMAQ Modeled S & N Dry Deposition Data enhance/adjusted to (sparse) measurements for Gridded (12 km) Dry S & N Deposition Data Available 2000-2013
Combined Gridded (4 km) Total Deposition Data
S: 55% to 81% Wet in 2000
S: 36% to 71% Wet in 2013
N: 36% to 71% Wet in 2000
N: 36% to 79% Wet in 2013Available 2000-2013
2000 Wet S Deposition + 2000 Dry S Deposition = 2000 Total S Deposition
Slide91985
Wet
NO
3
Deposition
2013
Wet NO
3 Deposition
Slide101985 Wet
SO
4
Deposition
2013 Wet
SO
4
Deposition
Thanks to Bennet Lyon (the New Bennington NADP Site Supervisor) for the Maps!