
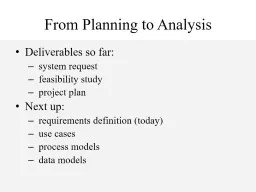
3 Requirements Analysis The process and technique that a group of system analyst utilizes to identify analyze and understand system requirements Systems requirements specify what the system must do as well as what property or quality the system must have ID: 695556
Download Presentation The PPT/PDF document "1 REQUIREMENTS ANALYSIS Context of Syste..." is the property of its rightful owner. Permission is granted to download and print the materials on this web site for personal, non-commercial use only, and to display it on your personal computer provided you do not modify the materials and that you retain all copyright notices contained in the materials. By downloading content from our website, you accept the terms of this agreement.


Slide1
1
REQUIREMENTS ANALYSISSlide2
Context of System AnalysisSlide3
3
Requirements AnalysisThe process and technique that a group of system analyst utilizes to identify, analyze, and understand system requirementsSystem’s requirements specify what the system must do as well as what property or quality the system must have. One of the early IS development phases.Data Model: one of the primary activities for the requirements analysis phase of the DB System DevelopmentSlide4
4
Relative Cost to Fix an ErrorSlide5
5
Relative Cost to Fix an Error (BASED ON CONSULTANT REPORTS & TRADE LITERATURE)
0
1
2
3
4
5
COSTS
ANALYSIS AND DESIGN
PROGRAMMING
CONVERSION
POSTIMPLELENTATIONSlide6
6
Results of Incorrect Requirements AnalysisThe system may cost more than projectedDenver airport Baggage-Handling ISThe system may be delivered later than promised.The system may not meet the users’ expectations and that dissatisfaction may cause them not to use it.Once in production, the costs of maintaining and enhancing the system may be excessively high.California DMV systemSlide7
7
Very Difficult to Manage Over the lifetime of the project, it is very common for new requirements to emerge and existing requirements to change. Studies have shown that over the life of a project as much as 50 percent or more of the requirements will change before the system is put into production. Slide8
8
System Development is about Documentation…….Data model is part of an official DB document (blue print of the DB)Department of JusticeSystem development is about “documentation….. Documentation…… documentation”See the Department of Justice SDLC documentation on the course websiteSlide9
IS ArchitectureCan be divided into data and process architecturesData architecture by Data ModelERD: focus on the optimal organization of data, not on where or how data are usedProcess architecture by Process ModelDFD (Data Flow Diagram): focus on how and when data are moved
9Slide10
10Information Systems ArchitectureDataArchitectureProcessArchitectureSlide11
How to develop IS Architecture? How the foundation of IS architecture should be developed? Strategic ManagementMission statement: root of strategic Mngt. Corporate StrategyIS Strategy IS architectureData (ERD) and Process (DFD) Architectures
11Slide12
What is Strategic Management?Highest level of overall planningis the continuous planning, monitoring, analysis, and assessment of all that is necessary for an organization to meet its goals & objectives and to position a firm to succeed in its market environment.Slide13
Strategic Management Process (con’t)
Components of Strategic Management Process
Strategic Management Process
(4:35)Slide14
What is Data Flow Diagram?A DFD is a graphical representation of the "flow" of data through an information system. How data enter a system and transformed in that systemWhat is a Data Flow Diagram and Why Do You Need One? (2:28)Slide15
Creating Data Flow Diagram
Lemonade Stand ExampleSlide16
Creating Data Flow Diagrams
Steps:
Create a list of activities
Construct Context Level DFD
(identifies sources and sink)
Construct Level 0 DFD
(identifies manageable sub processes )
Construct Level 1- n DFD
(identifies actual data flows and data stores )
Example
The operations of a simple lemonade stand will be used to demonstrate the creation of data flow diagram.Slide17
Creating Data Flow Diagrams
Example
Think through the activities that take place at a lemonade stand.
Customer Order
Serve Product
Collect Payment
Produce Product
Store Product
Order Raw Materials
Pay for Raw Materials
Pay for Labor
Create a list of activitiesSlide18
Creating Data Flow Diagrams
0.0
Lemonade System
EMPLOYEE
CUSTOMER
Pay
Payment
Order
Context Level DFD
Example
Create a context level diagram identifying the sources and sinks (users).
Customer Order
Serve Product
Collect Payment
Produce Product
Store Product
Order Raw Materials
Pay for Raw Materials
Pay for Labor
VENDOR
Payment
Purchase Order
Production Schedule
Received Goods
Time Worked
Sales Forecast
Construct Context Level DFD
(identifies sources and sink)
Product ServedSlide19
Creating Data Flow Diagrams
Level 0 DFD
Example
Create a level 0 diagram identifying the logical subsystems that may exist.
Customer Order
Serve Product
Collect Payment
Produce Product
Store Product
Order Raw Materials
Pay for Raw Materials
Pay for Labor
Construct Level 0 DFD
(identifies manageable sub processes )
2.0
Production
EMPLOYEE
Production
Schedule
1.0
Sale
3.0
Procure-ment
Sales Forecast
Product Ordered
CUSTOMER
Pay
Payment
Customer Order
VENDOR
Payment
Purchase Order
Order
Decisions
Received Goods
Time Worked
Inventory
Product Served
4.0
PayrollSlide20
Creating Data Flow Diagrams
Level 1 DFD
Example
Create a level 1 decomposing the processes in level 0 and identifying data stores.
Construct Level 1- n DFD
(identifies actual data flows and data stores )
1.3
Produce Sales Forecast
Sales Forecast
Payment
Customer Order
Serve Product
Collect Payment
Produce Product
Store Product
Order Raw Materials
Pay for Raw Materials
Pay for Labor
1.1
Record Order
Customer Order
ORDER
1.2
Receive Payment
PAYMENT
Severed Order
Request for Forecast
CUSTOMERSlide21
Process Decomposition
4.1
Record Time Worked
4.2
Calculate Payroll
4.3
Pay Employee
3.1
Produce Purchase Order
3.2
Receive Items
3.3
Pay Vendor
2.1
Serve Product
2.2
Produce Product
2.3
Store
Product
1.1
Record Order
1.2
Receive Payment
2.0
Production
1.0
Sale
3.0
Procure-ment
4.0
Payroll
0.0
Lemonade System
Level 0
Level 1
Context LevelSlide22
Why not using Flow Chart?Complex Logic: Many of today’s MIS program logic is quite complicated. In that case, flowchart becomes complex and clumsy because the complexity can grow exponentially. Not so recommendable in MIS & CSAlterations and Modifications: If alterations are required the flowchart may require re-drawing completely. This is quite time and effort-consuming.
22Slide23
Why not using Flow Chart?Reproduction: As the flowchart symbols cannot be typed, reproduction of flowchart becomes a problem.The essentials of what is done can easily be lost in the technical details of how it is done.Factors that affect the sequence are not included.
23