

with normal distributions are squared and summed Sampling distribution of s 2 The chisquare distribution results when independent variables with normal distributions are squared and summed ID: 415784
Download Presentation The PPT/PDF document "The chi-square distribution results when..." is the property of its rightful owner. Permission is granted to download and print the materials on this web site for personal, non-commercial use only, and to display it on your personal computer provided you do not modify the materials and that you retain all copyright notices contained in the materials. By downloading content from our website, you accept the terms of this agreement.


Slide1
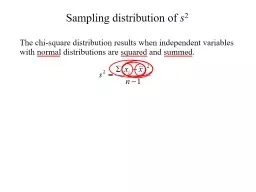
The chi-square distribution results when independent variables with normal distributions are squared and summed.
Sampling distribution of
s
2Slide2
The chi-square distribution results when independent variables with
normal
distributions are squared and summed.
0
n –
1
Sampling distribution of
c
2Slide3
The chi-square distribution results when independent variables with
normal
distributions are squared and summed.
.025
Sampling distribution of
c
2Slide4
The chi-square distribution results when independent variables with
normal
distributions are squared and summed.
.975
Sampling distribution of
c
2Slide5
Interval Estimation of
s
2
To derive the interval estimate of
2
,
first substitute
(
n
- 1)
s2/ 2 for c2 into the following inequality
Now write the above as two inequalitiesSlide6
Next, multiply the inequalities by
2
Divide both of the inequalities above by the respective chi-square critical value:
Interval Estimation of
s
2Slide7
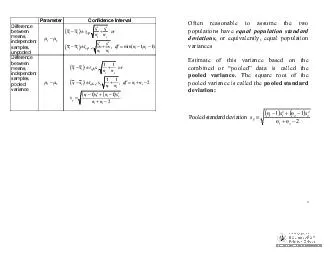
Interval Estimation of s 2
The
95% confidence interval for the population varianceSlide8
Interval Estimation of s 2
1 - a
/2a/2
The
1 - a
confidence interval for the population varianceSlide9
Buyer’s Digest rates thermostats manufactured for home temperature control. In a recent test, ten thermostats manufactured by ThermoRite were selected at random and placed in a test room that was maintained at a temperature of 68oF. Use the ten readings in the table below to develop a 95% confidence interval estimate of the population variance. Example 1
Temperature 67.4 67.8 68.2 69.3 69.5 67.0 68.1 68.6 67.9 67.2
Thermostat 1 2 3 4 5 6 7 8 9
10
Interval Estimation of
s
2Slide10
67.4 67.8 68.2 69.3 69.5
67.068.1 68.667.967.2
-0.7
-0.3
0.1
1.2
1.4-1.1
0.00.5-0.2-0.9
0.49
0.09
0.01
1.441.961.210.000.250.040.81
sum = 6.3
s
2
= 0.7
Interval Estimation of
s
2Slide11
Interval Estimation of s 2
(10
-
1)(0.7)
(10
-
1)(0.7)Slide12
Interval Estimation of s 2
(10
-
1)(0.7)
(10
-
1)(0.7)
2
9
0
.025
.025
1-
a
= .95
0.975
0.25Slide13
Selected Values from the Chi-Square Distribution Table
Degrees
Area in Upper Tail
of Freedom
.99
.975
.95
.90
.10
.05
.025
.01
5
0.554
0.831
1.145
1.610
9.236
11.070
12.832
15.086
6
0.872
1.237
1.635
2.204
10.645
12.592
14.449
16.812
7
1.239
1.690
2.167
2.833
12.017
14.067
16.013
18.475
8
1.647
2.180
2.733
3.490
13.362
15.507
17.535
20.090
9
2.088
2.700
3.325
4.168
14.684
16.919
19.023
21.666
10
2.558
3.247
3.940
4.865
15.987
18.307
20.483
23.209
Interval Estimation of
s
2Slide14
Interval Estimation of s 2
(10
-
1)(0.7)
(10
-
1)(0.7)
0.975
0.25
We are 95% confident that the population
variance is in this intervalSlide15
Recall that Buyer’s Digest is rating ThermoRite thermostats. Buyer’s Digest gives an “acceptable” rating to a thermostat with a temperature variance of 0.5 or less.
Conduct a hypothesis test--at the 10% significance level--to
determine whether the ThermoRite thermostat’s temperature variance is “acceptable”.
Hypotheses:
Recall that
s
2
=
0.7
and
df
= 9. With = 0.5,
Example 2
Hypothesis Testing – One VarianceSlide16
a = .10 (column)
Selected Values from the Chi-Square Distribution Table
Degrees
Area in Upper Tail
of Freedom
.99
.975
.95
.90
.10
.05
.025
.01
5
0.554
0.831
1.145
1.610
9.236
11.070
12.832
15.086
6
0.872
1.237
1.635
2.204
10.645
12.592
14.449
16.812
7
1.239
1.690
2.167
2.833
12.017
14.067
16.013
18.475
8
1.647
2.180
2.733
3.490
13.362
15.507
17.535
20.090
9
2.088
2.700
3.325
4.168
14.684
16.919
19.023
21.666
10
2.558
3.247
3.940
4.865
15.987
18.307
20.483
23.209
Our value
and
df
= 10 – 1 = 9 (row)
Hypothesis Testing – One VarianceSlide17
.10
Do not reject
H
0
Reject
H
0
9
There
is insufficient evidence to conclude that the temperature variance for
ThermoRite
thermostats is unacceptable.
= .10
Hypothesis Testing – One VarianceSlide18
The F-distribution results from taking the ratio of variances of normally distributed variables.
Sampling distribution of
F
if
s
1
2
=
s
2
2
Slide19
The F-distribution results from taking the ratio of variances of normally distributed variables.
Sampling distribution of
F
Bigger
≈
1
if
s
1
2
=
s
2
2
0
1Slide20
.025
The
F-distribution
results from taking the ratio of variances of normally distributed variables.
Sampling distribution of
F
≈
1Slide21
The
F-distribution
results from taking the ratio of variances of normally distributed variables.
Sampling distribution of
F
≈
1
.975Slide22
Buyer’s Digest has conducted the same test, but on 10 other thermostats. This time it test thermostats manufactured by TempKing. The temperature readings of the 10 thermostats are listed below.
We will conduct a hypothesis at a 10% level of significance to see if the variances are equal for both thermostats.
Example 3
ThermoRite Sample
TempKing Sample
Temperature
67.4 67.8 68.2 69.3 69.5 67.0 68.1 68.6 67.9 67.2
Temperature
67.7 66.4 69.2 70.1 69.5 69.7 68.1 66.6 67.3 67.5
s
2
=
0.7
and
df
= 9
s
2
=
?
and
df
= 9
Hypothesis Testing – Two VariancesSlide23
67.766.469.270.169.5
69.768.166.667.367.5
-0.51
-1.81
0.99
1.89
1.291.49
-0.11-1.61-0.91-0.71
0.2601
3.2761
0.9801
3.57211.66412.22010.01212.59210.82810.5041
sum = 15.909
s
2
= 1.768
TempKing
Since this is larger
Than ThermoRite’s
Hypothesis Testing – Two VariancesSlide24
n1 = 10 – 1 = 9 (column)
Selected Values from the F Distribution Table
Denominator
Area in
Numerator Degrees of Freedom
Degrees
Upper
of Freedom
Tail
7
8
9
10
15
.01
6.18
6.03
5.91
5.81
5.52
9
.10
2.51
2.47
2.44
2.42
2.34
.05
3.29
3.23
3.18
3.14
3.01
.025
4.20
4.10
4.03
3.96
3.77
.01
5.61
5.47
5.35
5.26
4.96
&
n
2
- 1 =
9
a
/2
= .05 (row)
Hypothesis Testing – Two Variances
Hypotheses:Slide25
.05
Reject
H
0
Do not Reject
H
0
Reject
H
0
≈
1
There is insufficient evidence to conclude that the population variances differ for the two thermostat brands.
.05
Hypothesis Testing – Two Variances