
Distribution of Spike Widths Interaction of Inhibitory and Excitatory Neurons During Visual Stimulation David Maher Department of Neurobiology and Anatomy University of Texas Houston Medical School TX 77030 ID: 595922
Download Presentation The PPT/PDF document "Two Mean Neuronal Waveforms" is the property of its rightful owner. Permission is granted to download and print the materials on this web site for personal, non-commercial use only, and to display it on your personal computer provided you do not modify the materials and that you retain all copyright notices contained in the materials. By downloading content from our website, you accept the terms of this agreement.


Slide1
Two Mean Neuronal Waveforms
Distribution of Spike Widths
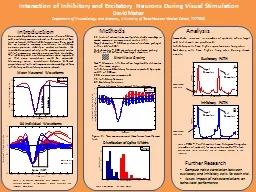
Interaction of Inhibitory and Excitatory Neurons During Visual Stimulation
David Maher
Department of Neurobiology and Anatomy, University of Texas Houston Medical School, TX 77030
An unsolved problem in neuroscience is how inhibitory and excitatory neurons interact in the context of their local network. Without inhibitory neurons there would be an epileptic runaway excitation, so inhibitory neurons preserve stability in cortical networks. We recorded neuronal activity in the primary visual cortex (V1) of a macaque monkey using multiple electrodes. The inhibitory and excitatory neurons were separated so that noise correlations could be measured. Measuring noise correlations between different populations of cells will improve our knowledge of how inhibitory and excitatory neurons interact.
Introduction
Methods
11 trials of extracellular multiple-electrode recordings in awake macaque primary visual cortex (V1). Target stimulus – 300 ms picture of sine-wave grating at either 45° or 135°. Test stimulus – 300 ms picture of sine-wave grating 0°,5°, or 10° different from target stimulus. Task – Macaque lifts bar when target and test stimulus are the same angle. Inhibitory and Excitatory Neurons separated by a spike width of 200 ms. 138 neurons were examined. 71 Inhibitory Neurons 67 Excitatory Neurons
Sine-Wave Grating
Mean Neuronal Waveforms
30 Individual Waveforms
Figure 1. (A) Average waveform of all Inhibitory and Excitatory neurons. (B) 30 individual mean Excitatory and Inhibitory waveforms.
Figure 3. Distribution of spike widths.
A
B
Analysis
Immediate
increase in number of spikes/s when target and test stimuli are produced.
Inhibitory
cells have higher spontaneous firing rates.
Excitatory
cells have higher firing rates during stimuli events.
Excitatory PSTH
Inhibitory PSTH
Figure 4. PSTH – Post-stimulus time histogram: Firing rates (number of spikes/s) for every millisecond of the trial.Average PSTH for (A) Excitatory and (B) Inhibitory neurons in the same trial.
A
B
Test Stimulus
Test
Stimulus
Target
Stimulus
Target
Stimulus
Further Research
Compute noise correlation between excitatory and inhibitory cells for each trial.
Asses impact of noise correlations on behavioral performance
Figure 2. Two mean neuronal Waveforms from the same trial.
Spike Width
Spike Width
Inhibitory
Excitatory
Spike Width
350 ms
170 ms
Spontaneous
Firing Rate
Spontaneous
Firing RateSlide2
Target Stimulus – 45°
300 ms
Test Stimulus – 55
°
300 ms
300 ms
Monkey holds on to bar
Target Stimulus – 45°
300 msTest Stimulus – 45 °
300 ms300 msMonkey releases barSame AngleDifferent AngleSlide3Slide4
Spike Width
2
50
ms
100
ms
+/- 1/2 Standard DeviationSlide5
Spike Width