
A Fluorescenceactivated cellsorting FACS workflow schematic BE Immunofluorescence staining IF of term cellsorted sample with known characteristic cell type markers that were not selected for in the FACS procedure ID: 1045614
Download Presentation The PPT/PDF document "Figure S1. Fluorescence-activated cell-s..." is the property of its rightful owner. Permission is granted to download and print the materials on this web site for personal, non-commercial use only, and to display it on your personal computer provided you do not modify the materials and that you retain all copyright notices contained in the materials. By downloading content from our website, you accept the terms of this agreement.


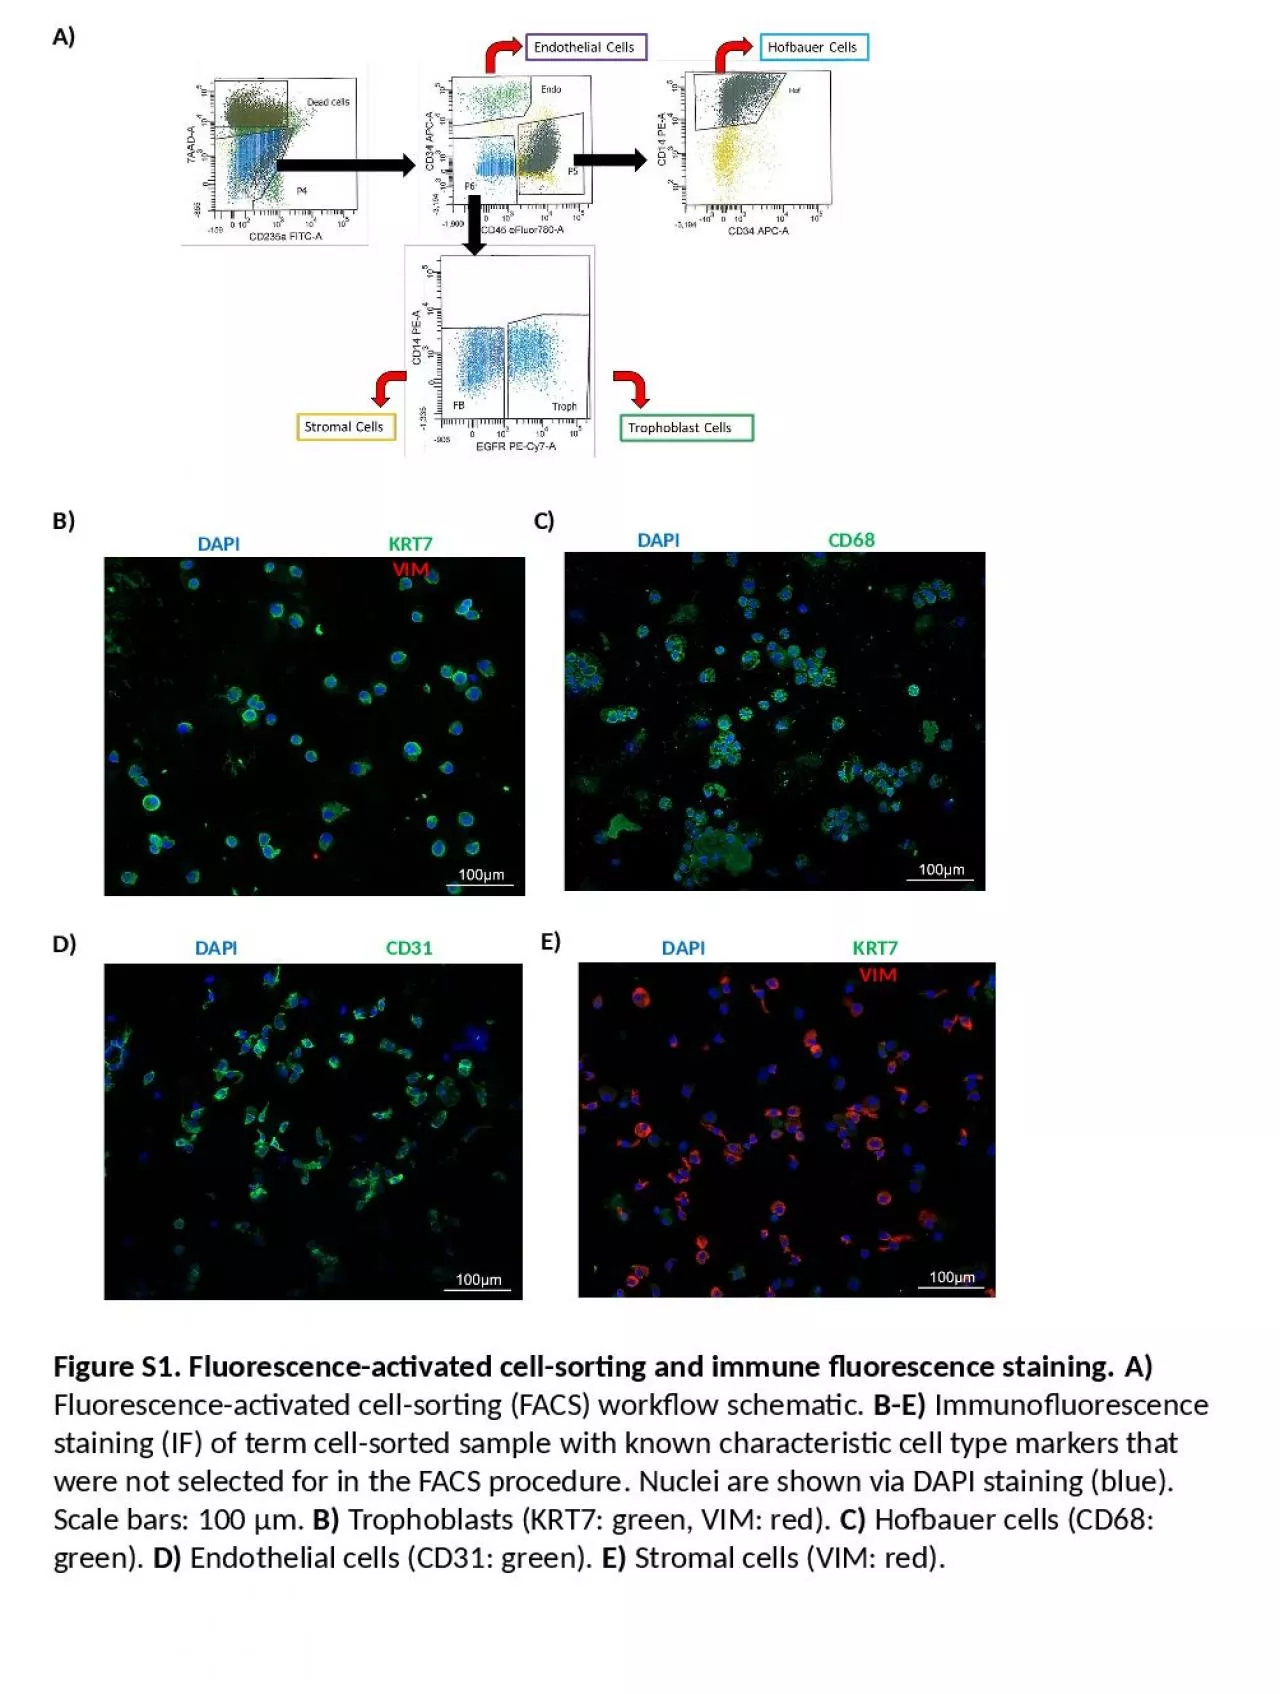
1. Figure S1. Fluorescence-activated cell-sorting and immune fluorescence staining. A) Fluorescence-activated cell-sorting (FACS) workflow schematic. B-E) Immunofluorescence staining (IF) of term cell-sorted sample with known characteristic cell type markers that were not selected for in the FACS procedure. Nuclei are shown via DAPI staining (blue). Scale bars: 100 µm. B) Trophoblasts (KRT7: green, VIM: red). C) Hofbauer cells (CD68: green). D) Endothelial cells (CD31: green). E) Stromal cells (VIM: red).A)B)HofC)D)E)DAPI KRT7 VIMDAPI CD68DAPI CD31DAPI KRT7 VIM
2. PL289 HofbauerPL296 TrophoblastsPL289 Trophoblasts0.20.40.60.81.00.70.80.91.0Normalized X intensityNormalizedY intensityFM1. Fit linear model in males2. Predict on females3. Normalize distributionto 0-14. Reverse, such that 1 = 100%0.70.80.91.00.70.80.91.00.70.80.91.00.70.80.91.00.000.250.500.751.00Genetic correlation to referenceMeasure ofmaternalcontaminationSexFMFigure S2. Identifying maternal contamination. A) Total intensity over all probes from X and Y chromosomes normalized to total autosomal intensity can be used to determine sex. B) Within-donor sample-sample correlation on SNP probes. C) SNP distributions (n = 59 probes). D) Theoretical relationship between the average probability SNP is an outlier from the expected distribution, and maternal contamination. E) Empirically observed relationship between the average probability a SNP is an outlier, and normalized Y intensity, in male samples. Normalized Y intensity is a quantifiable measure of maternal contamination in male samples. F) Training a linear predictor of maternal contamination in male samples, then applying it to female samples.A)B)C)D)E)F)0%10%20%30%40%50%0.40.60.8Normalized Y intensityP(SNP is outlier)0.900.780.990.710.970.920.930.810.990.73HofbauerEndothelialStromalTrophoblastsVilliTrophoblastsStromalEndothelial0.70.80.91.0GeneticcorrelationPL289EndothelialHofbauerStromalTrophoblastsVilliFirst TrimesterTerm0%50%100%0%50%100%SNPs (n=59)
3. TECH_WeekTECH_Chip_numberTECH_Row_numericTECH_Row_factorTECH_Batch_BSCSexTrimesterTissue010203040% variance explained1234567891011121314151617181920PC1234567891011121314151617181920PCP value> 0.05< 0.05< 0.01< 0.001Figure S3. Principal component (PC) associations with phenotype variables. Principal components were tested for their association with various biological and technical sample variables. Each PC was tested individually in a simple linear model with each sample variable.
4. ***********************************************************************************************More MethylatedLess Methylated0%50%100%0%50%100%islandseashelfshoreenhancer1to5kb3UTR5UTRexonintergenicintronintronexonboundarypromoterpmd*Enriched(bonferroni p < 0.001)Expected frequencyFigure S4. First trimester differentially methylated CpGs enrichment for genomic location. First trimester differentially methylated CpGs were tested for enrichment at various genomic features (e.g. CpG island, enhancers, gene transcripts, PMDs).
5. EndothelialHofbauerStromalTrophoblastsVilliuc002ehz.4uc010ccc.3uc010vhd.2MMP255 515 00055 530 000positionEndothelialHofbauerStromalTrophoblastsVilliuc003pbp.3uc010jzr.2GCM152 995 00053 010 000positionDMCSEndothelialHofbauerStromalTrophoblastsVilliuc002pfq.3uc002pfr.3uc002pfs.3uc010xyh.2SLC1A547 280 00047 295 000positionpromotersexonsintronsEndothelialHofbauerStromalTrophoblastsVilliuc001ijy.1GATA3uc001ijz.3GATA3uc001ika.3GATA3-AS1uc001ijx.1GATA3-AS1uc010qbe.1GATA3-AS1uc010qbf.1GATA3-AS1uc010qbg.1GATA38 100 0008 115 000positionFigure S5. Mean DNAm for each cell type across CpGs in selected functionally-relevant genes. Average term placental cell-specific DNA methylation across select genes. Differentially methylated regions (defined as regions with a high density of differentially methylated CpGs), are highlighted with a grey background.
6. EndothelialHofbauerStromalTrophoblastsVilliuc002mvc.3JUNB12 895 00012 900 000positionEndothelialHofbauerStromalTrophoblastsVilliTEAD3uc003okt.3TEAD3uc003oku.4TEAD3uc010jvx.3TULP1uc003okv.4TULP1uc003okw.4TEAD335 445 00035 460 000promotersexonsintronsEndothelialHofbauerStromalTrophoblastsVilliuc003plj.2uc021zci.1CGA87 805 00087 807 500positionEndothelialHofbauerStromalTrophoblastsVilliuc003yue.2uc003yuf.1uc003yug.2uc003yuh.2uc003yui.1uc010mee.2uc010mef.2uc011ljh.1uc011lji.1NDRG1134 250 000134 275 000134 300 000Figure S6. Mean DNAm for each cell type across CpGs in selected preeclampsia genes. Average term placental cell-specific DNA methylation across select genes. Differentially methylated regions (defined as regions with a high density of differentially methylated CpGs), are highlighted with a grey background.
7. 73%68%70%66%73%68%65%63%72%68%EndothelialHofbauerStromalTrophoblastsVilliFirst TrimesterTerm50%100%50%100%50%100%50%100%50%100%0123401234DNA methylationMaternal (# CpGs = 895)Figure S7. Density graphs of CpGs in imprinted regions. A) Density plots (y-axis) of imprinted regions divided into those that are imprinted in more than one tissue (top) and placental-specific (bottom). The percentage of CpGs falling within 25%-75% is labelled in each plot. First trimester samples are shown. B) Maternal imprinted regions. Density of DNAm at CpGs in maternally imprinted regions. The total percentage of CpGs that have 25% - 75% DNAm are shown in each plot. C) Paternally imprinted regions.86%81%78%79%87%81%84%80%86%84%EndothelialHofbauerStromalTrophoblastsVilliFirst TrimesterTerm50%100%50%100%50%100%50%100%50%100%0123401234DNA methylationPaternal(# CpGs = 190)75%55%72%9%75%48%68%72%74%83%EndothelialHofbauerStromalTrophoblastsVilliUbiquitous(# CpGs = 1085)Placental-specific(# CpGs = 981)50%100%50%100%50%100%50%100%50%100%02460246DNA methylationA)B)C)
8. 0%50%100%DNAmethylationEnhancerPlacental PMDImprinted DMR (General)Imprinted DMR (Placenta)Relation to CpG Islandsuc003fsx.3 (FGF12)uc003fsy.3 (FGF12)Trimester: ThirdFGF12AnnotationsTranscriptsCpG0%50%100%DNAmethylationEnhancerPlacental PMDImprinted DMR (General)Imprinted DMR (Placenta)Relation to CpG Islandsuc001ktp.2 (FGF8)uc001ktq.2 (FGF8)uc001ktr.2 (FGF8)uc001kts.2 (FGF8)uc009xwr.2 (FGF8)uc021pxg.1 (FGF8)uc001ktt.3 (NPM3)uc001ktu.2 (OGA)uc001ktv.2 (OGA)uc009xws.2 (OGA)uc010qqe.1 (OGA)Trimester: ThirdFGF8AnnotationsTranscriptsCpGEndothelialHofbauerStromalTrophoblastsVilliSeaShelfShoreIslandPresentAbsent 1to5kbpromoter5UTRexonintron3UTRFigure S8. DNAm at imprinted regions for specific genes. A) Cell-specific DNAm at placental-specific imprinted regions for genes FGF8 and B) FGF12.A)B)
9. Imprinted DMR (Placenta)0%50%100%DNAmethylationEnhancerPlacental PMDImprinted DMR (General)Relation to CpG Islandsuc001vpe.2 (FGF14)uc001vpf.2 (FGF14)uc021rme.1 (MIR2681)Trimester: ThirdFGF14AnnotationsTranscriptsCpGFigure S9. DNAm at imprinted regions for specific genes. A) Cell-specific DNAm at placental-specific imprinted regions for genes JMJD1C and B) FGF14.0%50%100%DNAmethylationEnhancerPlacental PMDImprinted DMR (General)Imprinted DMR (Placenta)Relation to CpG Islandsuc001jmn.3 (JMJD1C)uc001jmr.1 (JMJD1C)uc010qir.2 (JMJD1C-AS1)TermJMJD1CAnnotationsTranscriptsCpGA)B)EndothelialHofbauerStromalTrophoblastsVilliSeaShelfShoreIslandPresentAbsent 1to5kbpromoter5UTRexonintron3UTR
10. 0%50%100%DNAmethylationEnhancerPlacental PMDImprinted DMR (General)Imprinted DMR (Placenta)Relation to CpG Islandsuc002bep.3 (RASGRF1)uc002beq.3 (RASGRF1)uc010blm.1 (RASGRF1)uc002ber.4 (RASGRF1)TermRASGRF1AnnotationsTranscriptsCpGEndothelialHofbauerStromalTrophoblastsVilliSeaShelfShoreIslandPresentAbsent 1to5kbpromoter5UTRexonintronA)Figure S10. DNAm at imprinted regions for specific genes. A) Cell-specific DNAm at placental-specific imprinted regions for genes RASGRF1.
11. p<0.001p=0.04p<0.001p<0.001p=0.02p<0.001p<0.001p=0.03650%60%70%80%90%All probesAluL1Mean DNAmTerm50%60%70%80%All probesAluL1Mean DNAmFirst trimesterB)p<0.001p<0.001p<0.001p<0.001p<0.00175%100%REMP_AluREMP_L1Mean DNAmC)Figure S11. DNAm summarized over repetitive elements. A) Repetitive element DNA methylation. CpG sites overlapping Alu and Line 1 (L1) elements were determined using the ‘rmsk’ track from UCSC. Mean DNAm over these CpGs was calculated for each term cell-sorted and villi sample. B) First trimester mean DNAm across repetitive elements and all 850k CpGs. C) REMP-predicted repetitive element DNAm in term samples.A)EndothelialHofbauerStromalTrophoblastsVilliEndothelialHofbauerStromalTrophoblastsVilli
12. A)B)Figure S12. Comparison of cell deconvolution algorithms. A) Estimated percentage by deconvolution (y-axis) by actual percentage used to construct in silico mixtures (x-axis). Performance metrics are shown for each algorithm and cell type. RMSE, root mean squared error; R2, R squared; MAE, mean absolute error. B) Distribution of deviations from deconvolution estimates and actual percentages for in silico mixtures. The mean deviation (estimated minus actual) is labelled in each panel as text, and as the dotted vertical line.