
DO NOW Worksheet Describe life in various countries Socially Economically Demographically Human Development Index A countrys level of development can be distinguished according to three factors ID: 916095
Download Presentation The PPT/PDF document "AIM: WHY DOES DEVELOPMENT VARY BETWEEN C..." is the property of its rightful owner. Permission is granted to download and print the materials on this web site for personal, non-commercial use only, and to display it on your personal computer provided you do not modify the materials and that you retain all copyright notices contained in the materials. By downloading content from our website, you accept the terms of this agreement.


Slide1
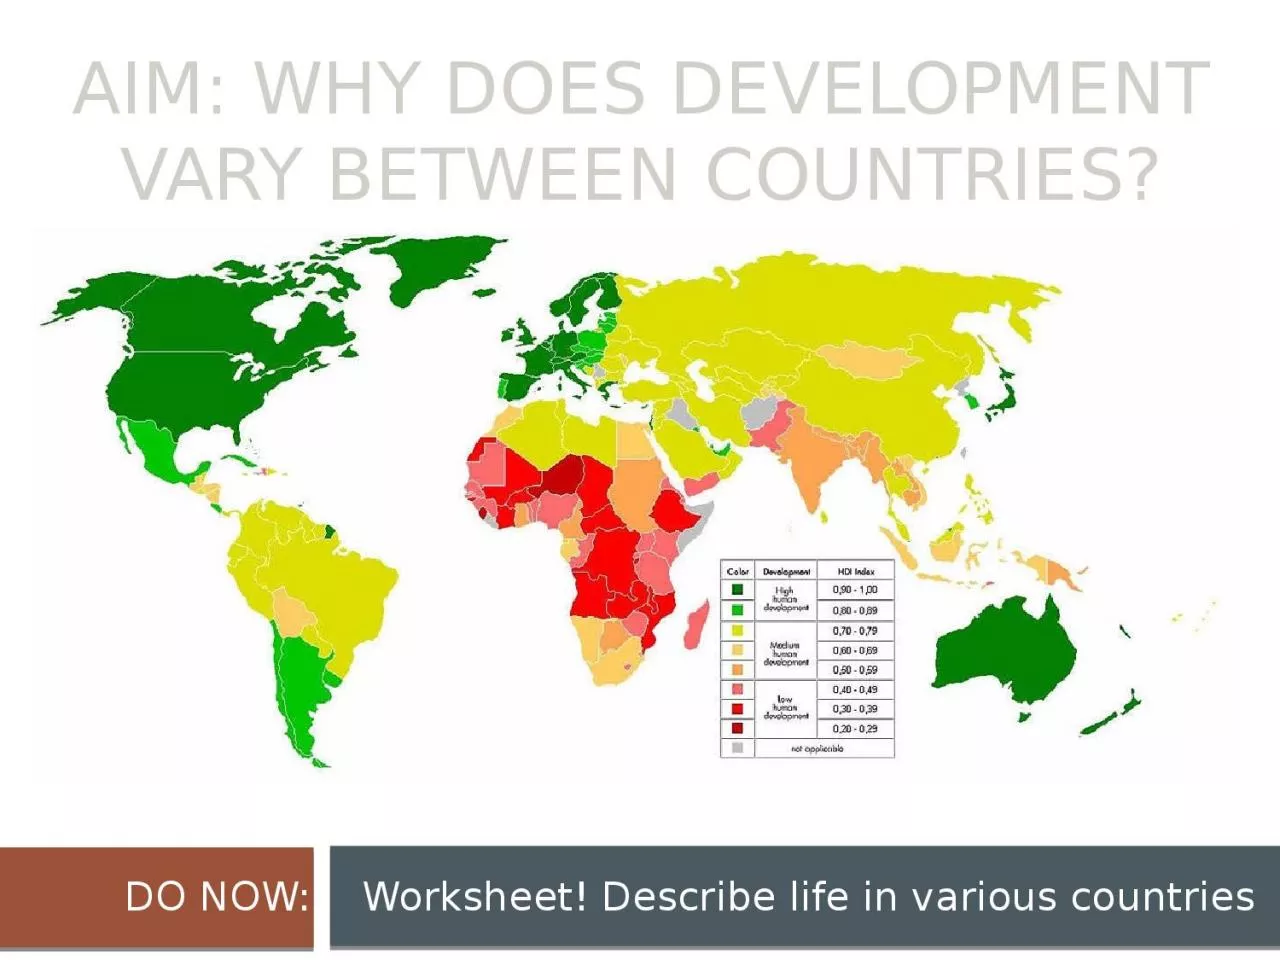
AIM: WHY DOES DEVELOPMENT VARY BETWEEN COUNTRIES?
DO NOW: Worksheet! Describe life in various countries
Slide2Socially
Economically
Demographically
Slide3Human Development Index
A country’s level of development can be distinguished according to three factors – social, economic, and demographic.
The
Human Development Index (HDI)
, created by the
United Nations
, recognizes that a country’s level of development is a function of all three of these factors.
Slide4Human Development Index (HDI)
Four factors are combined to produce country’s HDI
GDP (gross domestic product) per capita
Literacy rate
Amount of education
Life expectancy
Slide5Slide6Slide7Can you name the top 3 countries with the highest HDI?
Slide8United States: Can you guess...
Life Expectancy
Average years of schooling
Slide9HDI 2014
Slide10ECONOMIC MEASURE
Gross Domestic Product (GDP
):
value of the total output of goods and services produces in a country, normally during a year
GDP per capita
Dividing GDP by total population measures contribution made by the average individual toward generating a country’s wealth
Slide11GDP UNITED STATES
GDP = $12 trillionPopulation = 300 millionGDP per capita = $40,000
Measures average (mean) wealth, not distribution. Cannot perfectly measure level of development
Slide12Slide13SOCIAL INDICATORS
level of development, the greater are both the quantity and quality of education
Quantity:
average number of school years attended
Quality:
student/teacher ratio and literacy rate
Literacy rate:
percentage of a country’s people who can read and write
Slide14Education MDCs vs. LDCs
Average pupil attends school for about 10 years in MDCs
vs. couple years in
LDCs
Student-teacher ratio is twice as high in
LDCs
as in
MDCs
Slide15Slide16DEMOGRAPHIC INDICATORS
Life Expectancy:
average number of years a newborn infant can be expected to live
LDCs
– 60s
MDCs
– 70s
Slide17Slide18Other Factors the Determine Development of Countries
Slide19ECONOMIC FACTORS
Types of Jobs (primary, secondary, tertiary)
Productivity (gross value of product minus cost of raw materials and energy)
Raw Materials
Consumer goods
Slide20SOCIAL FACTORS
Health and Welfare
Slide21DEMOGRAPHIC FACTORS
Infant Mortality Rate
Natural Increase Rate
Crude Birth Rate
Slide22Slide23AIM: Where are more and less developed countries?
DO NOW: Vocabulary
Slide24Slide25REGIONS OF THE WORLD
MORE DEVELOPED
Anglo America
Western Europe
Eastern Europe
Japan
South Pacific
LESS DEVELOPED
Latin America
East Asia
Middle East
Southeast Asia
South Asia
Sub-Saharan Africa
Slide26Slide27AIM:
Where does level of development vary by gender?
DO NOW:
Slide28Gender-Related Development Index
Compares the level of development of women with that of both sexes
Gender
Empowerment Measure
Compares ability of women and men to participate in economic
and political decision making
Slide29Gender-Related Development Index
(GDI)
Uses the same indicators as HDI
Income
Literacy
Education
Life expectancy
High GDI means both men and women have achieved a high level of development
Low GDI means that women have a low level of development
Slide30Slide31Slide32https://www.youtube.com/watch?v=llj7LzTULog
Global Gender Gap Report 2015
Slide33Gender-Related Development Index
(GDI)
ECONOMIC INDICATOR
Average income for females is lower than males in every country in the world
Slide34Slide35Gender-Related Development Index
(GDI)
SOCIAL INDICATOR
Education & Literacy
Women less likely to attend schools in
LDCs
Gap is especially high in secondary level
Women:Men
99:100 in
MDCs
, 60:100
LDCs
Slide36Gender-Related Development Index
(GDI)
SOCIAL INDICATOR
LDCs
Sub-Saharan Africa & Middle East fewer than one-third of girls attend school
In Latin America and Asia, boys and girls are equally likely but attendance is much less than in
MDCs
Slide37Slide38Gender-Related Development Index
(GDI)
DEMOGRAPHIC INDICATOR
Life expectancy
Gender gap greater in
MDCs
than
LDCs
Women expected to live longer in
MDCs
Slide39Slide40Fostering Gender Equality & Empowerment
https://www.youtube.com/watch?v=KxECHRlrHu8
Slide41Gender Empowerment
GEM measures the ability of women to participate in the process of achieving those improvements
two indicators of economic power
income
professional jobs
two indicators of political power
managerial jobs
elected jobs
Slide42Gender Empowerment
Countries with the highest GEMS are
MDCs
, especially in North America, Northern Europe and South Pacific
Slide43Interactive Gender Gap Map
http://widgets.weforum.org/gender-gap-heat-map/
Slide44Malala
https://www.youtube.com/watch?v=gjGL6YY6oMs&feature=youtu.be
Slide45He for She Campaign
https://www.youtube.com/watch?v=7ZptgM-jhZo
Slide46Slide47AIM: Why do less developed countries face obstacles to development?
DO NOW: Development Index Review
Slide48Increasing per capita GDP more rapidly
Using additional funds to make more rapid improvements in people’s social and economic conditions
To reduce disparities between rich and poor countries,
LDCs
must develop more rapidly.
Slide49Two Obstacles
Adopting policies that successfully promote development
Finding funds to pay for development
Slide50Promote Development
One of two ways to promote development
Self-Sufficiency
International Trade
Slide51Finding Funds
One of two ways to find funds
Loans from banks and international organizations
Direct investment by transnational corporations
Slide52Rostow Model
http://www.slideshare.net/geographyalltheway/ib-geography-develpent-rostow-model