
005 ANOVA Graphical Example ANOVA terms Treatment 1 Treatment 2 Treatment 3 1 y 11 48 y 21 40 y 31 39 2 y 12 39 y 22 48 y 32 30 3 y 13 42 ID: 1034302
Download Presentation The PPT/PDF document "Multiple Comparisons Overall Risk of Typ..." is the property of its rightful owner. Permission is granted to download and print the materials on this web site for personal, non-commercial use only, and to display it on your personal computer provided you do not modify the materials and that you retain all copyright notices contained in the materials. By downloading content from our website, you accept the terms of this agreement.


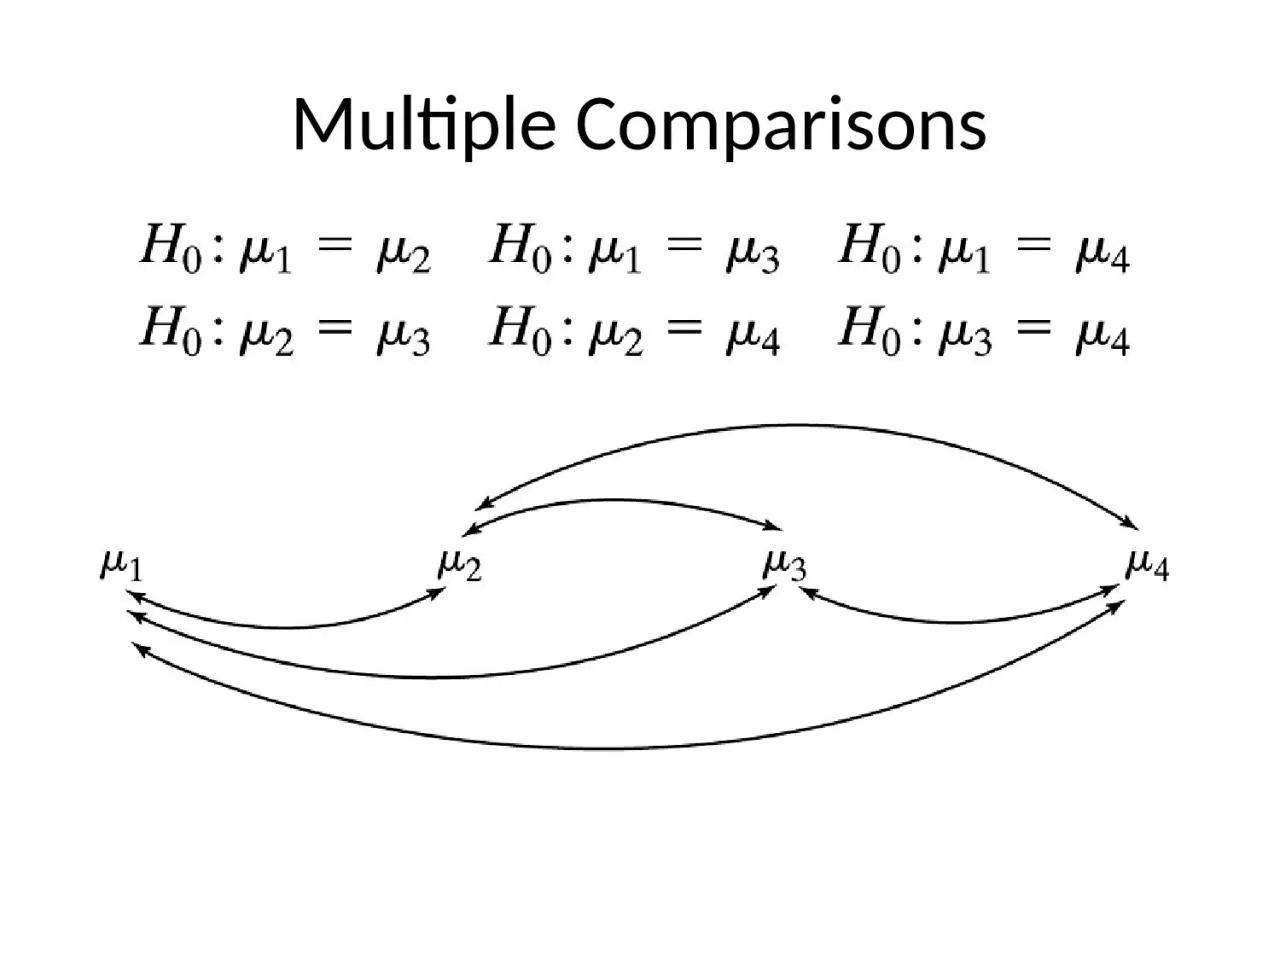
1. Multiple Comparisons
2. Overall Risk of Type I Error in Using Repeated t Tests at = 0.05
3. ANOVA: Graphical
4. Example: ANOVA termsTreatment 1Treatment 2Treatment 31y11 = 48y21 = 40y31 = 392y12 = 39y22 = 48y32 = 303y13 = 42y23 = 44y33 = 324y14 = 43y34 = 35Overalln1 = 4n2 = 3n3 = 4ȳ1 = 43ȳ2 = 44ȳ3 = 34s1 = 3.74s2 = 4s3 = 3.921140
5. ANOVA TableSourcedfSSMSBetween2228114Within812015Total10348
6. ANOVA Table: FormulasSourcedfSS(Sum of Squares)MS (Mean Square)BetweenI – 1SS/dfWithinn• – ITotaln• – 1
7. F distributionhttp://www.vosesoftware.com/ModelRiskHelp/index.htm#Distributions/Continuous_distributions/F_distribution.htm
8. F Table
9. Scientific Conclusion for F testThis study (does not) provide(s) evidence [(P = )] at the significance level that there is a difference in ____ among the ____ groups.
10. Example: ANOVAA random sample of 15 healthy young men are split randomly into 3 groups of 5. They receive 0, 20, and 40 mg of the drug Paxil for one week. Then their serotonin levels are measured to determine whether Paxil affects serotonin levels.
11. Example: ANOVA (cont).Dose0 mg20 mg40 mg48.6258.6068.5949.8572.5278.2864.2266.7282.7762.8180.1276.5362.5168.4472.33overallni55515ȳi57.6069.2875.7067.53si7.6787.8955.460(ni-1)si2235.78249.32119.24604.34ni(ȳi - y̅̅)2492.5615.36333.96841.88
12. Example: ANOVA (cont)SourcedfSSMSBetween2841.88420.94Within12604.3450.36Total141446.23
13. Example: ANOVA (cont)Does Paxil affect serotonin levels in healthy young men?Let 1 be the mean serotonin level for men receiving 0 mg of Paxil.Let 2 be the mean serotonin level for men receiving 20 mg of Paxil.Let 3 be the mean serotonin level for men receiving 40 mg of Paxil.
14. Example: ANOVA (cont)H0: 1 = 2 = 3; mean serotonin levels are the same at all 3 dosage levels [or, mean serotonin levels are unaffected by Paxil dose]HA: The mean serotonin levels of the three groups are not all equal. [or, serotonin levels are affected by Paxil does]
15. Example: ANOVA (cont)SourcedfSSMSBetween2841.88420.94Within12604.3450.36Total141446.23
16. Example: ANOVA (cont)SourcedfSSMSF-RatioP-ValueBetween2841.88420.948.360.0053Within12604.3450.36Total141446.23This study provides evidence (P = 0.0053) at the 0.05 significance level that there is a difference in serotonin levels among the groups of men taking 0, 20, and 40 mg of Paxil.This study provides evidence (P = 0.0053) at the 0.05 significance level that Paxil intake affects serotonin levels in young men.
17. Verification of Conditions
18. Example 11.6.1: Randomized Block ProcedureResearchers are interested in the effect that acid has on growth rate of alfalfa plants. To control sunlight, the randomized block procedure is used.
19. Example 11.6.9: F test
20. Example 11.7.3: Two-Way ANOVA
21. Example 11.7.4: Two-Way ANOVA
22. Bonferroni t Table
23. Example: ANOVAA random sample of 15 healthy young men are split randomly into 3 groups of 5. They receive 0, 20, and 40 mg of the drug Paxil for one week. Then their serotonin levels are measured to determine whether Paxil affects serotonin levels.
24. Example: Bonferroni AdjustmentDose0 mg20 mg40 mgoverallni55515y̅i57.6069.2875.7067.53SSi235.78249.32119.24604.34SourcedfSSMSF-RatioP-ValueBetween2841.88420.948.360.0053Within12604.3450.36Total141446.23
25. Example: Paxil, Graphical Representation 0 mg 20 mg 40 mg
26. Exercise 11.4.1 (MultComp.sas)data MAO;infile ‘H:\Ex.11.4.1.dat';input MAO diagnosis $;*I: Chronic, II: UndParanoid, III: ParanoidShiz;run;proc print data=MAO; run;Title 'Example of mulitple comparisons';proc glm data=MAO alpha=0.05;class diagnosis;model MAO = diagnosis;means diagnosis / bon cldiff lines; Bonferronimeans diagnosis / tukey cldiff lines; Tukeyrun;quit;X
27. Exercise 11.4.1 (Bonferroni cldiff) Bonferroni (Dunn) t Tests for MAO NOTE: This test controls the Type I experimentwise error rate, but it generally has a higher Type II error rate than Tukey's for all pairwise comparisons. Alpha 0.05 Error Degrees of Freedom 39 Error Mean Square 10.72442 Critical Value of t 2.50166 Comparisons significant at the 0.05 level are indicated by ***. Difference Simultaneous diagnosis Between 95% Confidence Comparison Means Limits Chronic - UndParan 3.524 0.709 6.339 *** Chronic - ParnoidS 3.843 0.362 7.324 *** UndParan - Chronic -3.524 -6.339 -0.709 *** UndParan - ParnoidS 0.319 -3.229 3.866 ParnoidS - Chronic -3.843 -7.324 -0.362 *** ParnoidS - UndParan -0.319 -3.866 3.229X
28. Exercise 11.4.1 (Bonferroni lines) The GLM Procedure Bonferroni (Dunn) t Tests for MAO NOTE: This test controls the Type I experimentwise error rate, but it generally has a higher Type II error rate than REGWQ. Alpha 0.05 Error Degrees of Freedom 39 Error Mean Square 10.72442 Critical Value of t 2.50166 Minimum Significant Difference 3.2978 Harmonic Mean of Cell Sizes 12.34286 NOTE: Cell sizes are not equal. Means with the same letter are not significantly different. Bon Grouping Mean N diagnosis A 9.806 18 Chronic B 6.281 16 UndParan B B 5.963 8 ParnoidSX
29. Exercise 11.4.1 (Tukey cldiff)The GLM Procedure Tukey's Studentized Range (HSD) Test for MAO NOTE: This test controls the Type I experimentwise error rate. Alpha 0.05 Error Degrees of Freedom 39 Error Mean Square 10.72442 Critical Value of Studentized Range 3.44546 Comparisons significant at the 0.05 level are indicated by ***. Difference Simultaneous diagnosis Between 95% Confidence Comparison Means Limits Chronic - UndParan 3.524 0.783 6.266 *** Chronic - ParnoidS 3.843 0.453 7.233 *** UndParan - Chronic -3.524 -6.266 -0.783 *** UndParan - ParnoidS 0.319 -3.136 3.774 ParnoidS - Chronic -3.843 -7.233 -0.453 *** ParnoidS - UndParan -0.319 -3.774 3.136X
30. Exercise 11.4.1 (Tukey lines) The GLM Procedure Tukey's Studentized Range (HSD) Test for MAO NOTE: This test controls the Type I experimentwise error rate, but it generally has a higher Type II error rate than REGWQ. Alpha 0.05 Error Degrees of Freedom 39 Error Mean Square 10.72442 Critical Value of Studentized Range 3.44546 Minimum Significant Difference 3.2116 Harmonic Mean of Cell Sizes 12.34286 NOTE: Cell sizes are not equal. Means with the same letter are not significantly different. Tukey Grouping Mean N diagnosis A 9.806 18 Chronic B 6.281 16 UndParan B B 5.963 8 ParnoidSX