
page 1 ECON 103 200 8 2 Due the Week of May 2 6 Chapter 4 WRITE 2 Graph the accompanying demand data and then use the midpoint formula for E d to determine price elasticity of demand for each o ID: 952808
Download Pdf The PPT/PDF document "ANSWERS TO HOME WORK ASSIGNMENTS" is the property of its rightful owner. Permission is granted to download and print the materials on this web site for personal, non-commercial use only, and to display it on your personal computer provided you do not modify the materials and that you retain all copyright notices contained in the materials. By downloading content from our website, you accept the terms of this agreement.


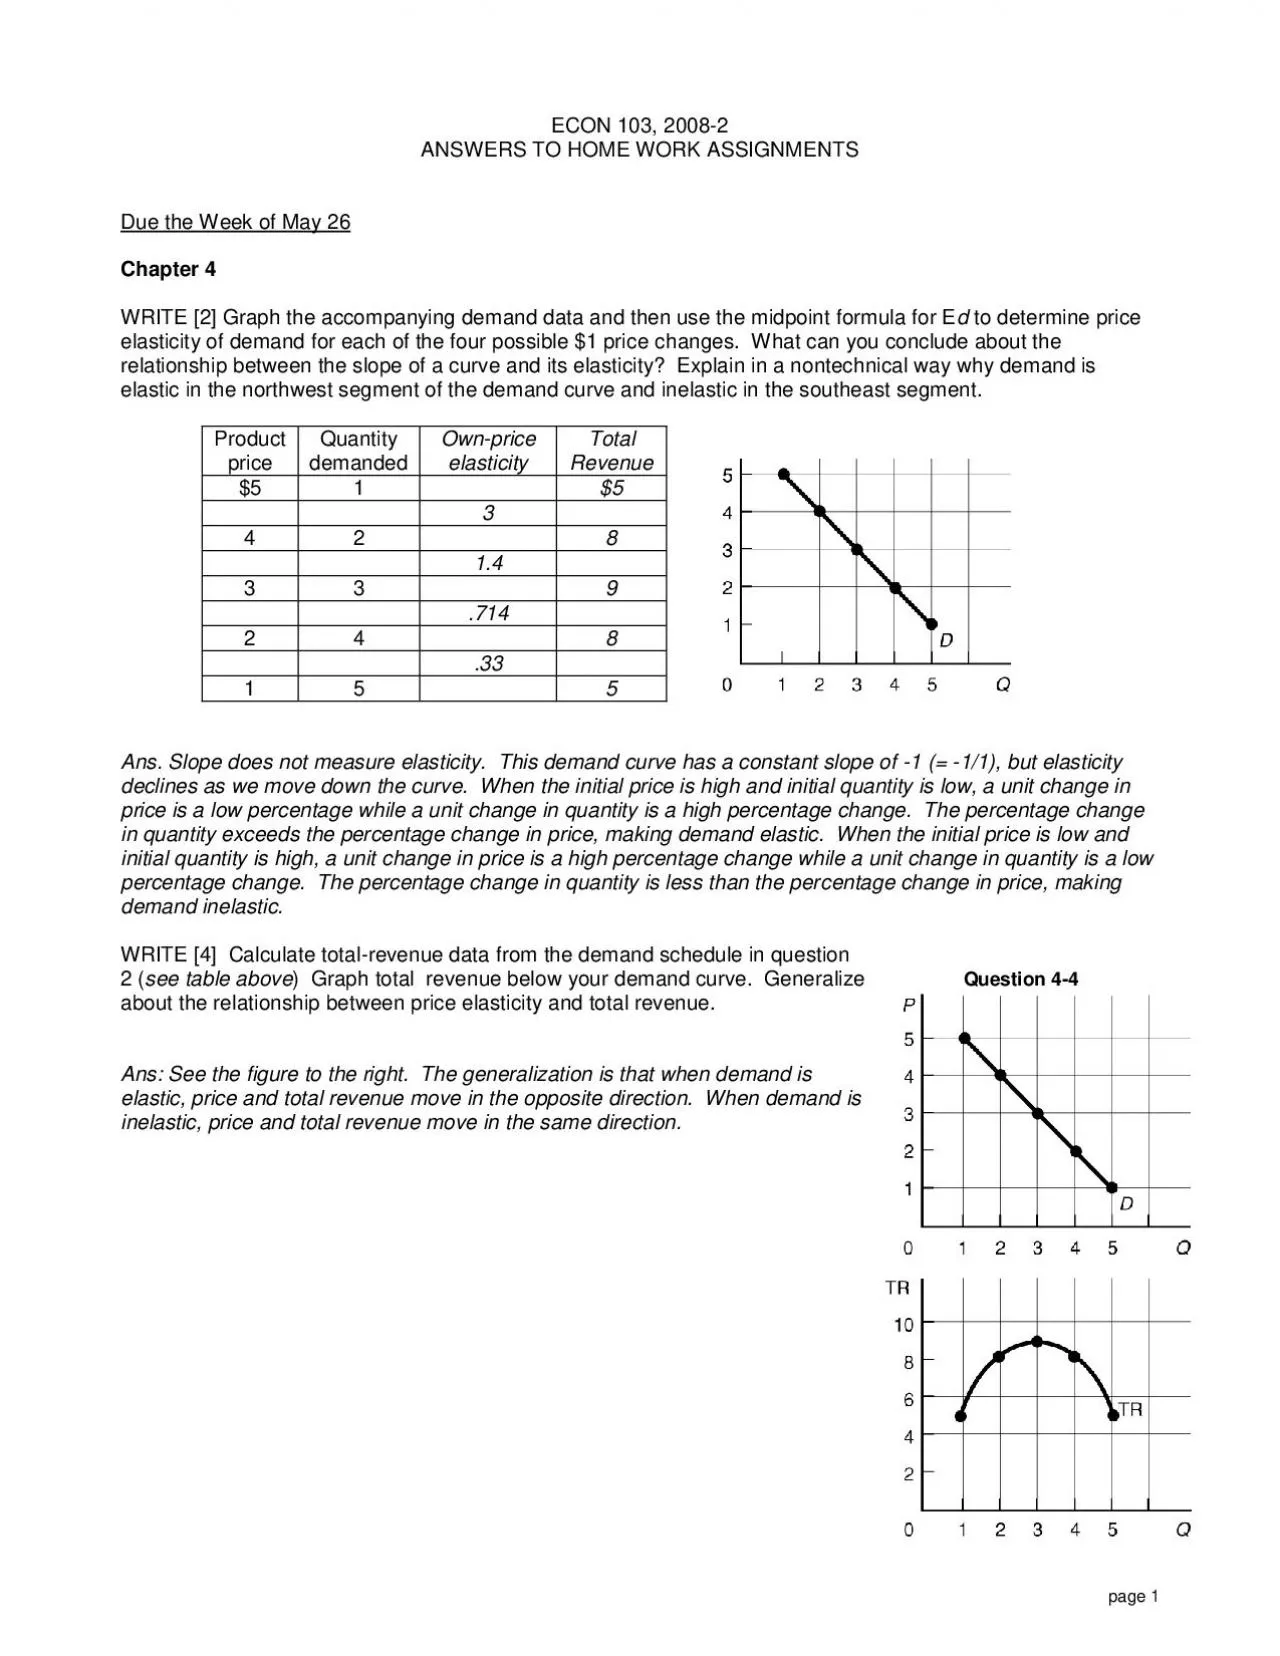
page 1 ECON 103, 200 8 - 2 ANSWERS TO HOME WORK ASSIGNMENTS Due the Week of May 2 6 Chapter 4 WRITE [2] Graph the accompanying demand data and then use the midpoint formula for E d to determine price elasticity of demand for each of the four possible $1 price c hanges. What can you conclude about the relationship between the slope of a curve and its elasticity? Explain in a nontechnical way why demand is elastic in the northwest segment of the demand curve and inelastic in the southeast segment. Product price Quantity demanded Own - price elasticity Total Revenue $5 1 $5 3 4 2 8 1.4 3 3 9 .714 2 4 8 .33 1 5 5 Ans. Slope does not measure elasticity. This demand curve has a constant slope of - 1 (= - 1/1), but elasticity declines as we move down the curve. When the initial price is high and initial quantity is low, a unit change in price is a low percentage while a unit change in quantity is a high percentage change. The percentage change in quantity exceeds the percentage change in p rice, making demand elastic. When the initial price is low and initial quantity is high, a unit change in price is a high percentage change while a unit change in quantity is a low percentage change. The percentage change in quantity is less than the per centage change in price, making demand inelastic. WRITE [4] Calculate total - revenue data from the demand schedule in question 2 ( see table above ) Graph total revenue below your demand curve. Generalize about the relationship between price elasticity a nd total revenue. Ans: See the figure to the right. The generalization is that when demand is elastic, price and total revenue move in the opposite direction. When demand is inelastic, price and total revenue move in the same direction. page 2 WRIT E [5] How would the following changes in price affect total revenue? That is, would total revenue increase, decline, or remain unchanged? a. Price falls and demand is inelastic. ( Total Revenue decreases ) b. Price rises and demand is elastic. ( Total Reven ue decreases ) c. Price rises and supply is elastic. ( Total Revenue increases ) d. Price rises and supply is inelastic. ( Total Revenue increases ) e. Price rises and demand is inelastic. ( Total
Revenue increases ) f. Price falls and demand is elastic. ( Tota l Revenue increases ) g. Price falls and demand is of unit elasticity. ( Total Revenue remains the same ) WRITE [7] The following is a straight - line demand curve that confronts a single firm. Price Quantity Demanded Total Revenue E d $6 1 $6 3.7 $5 2 $10 1.8 $4 3 $12 1 $3 4 $12 0.6 $2 5 $10 0.3 $1 6 $6 (a) In column 3, compute total revenue. In column 4, compute the coefficient for the price elasticity of demand at each price using the midpoints formula. (b) Describe the character of elasticity across the prices based on the total revenue test and the elasticity coefficient. (c) Does a straight - line demand curve have constant elasticity? (d) Of what practical significance is your answer to (c)? Ans: (a) See the above tab le for the answers. (b) Total revenue declines when price drops from $3 to $2, and the elasticity coefficient also becomes less than 1 at that price change. Demand is elastic in the range of prices between $6 and $4, and inelastic below $3. A drop in pri ce from $4 to $3 illustrates unitary elasticity. (c) The clear answer is “no” based on the answers in the table. Although the slope of a linear demand curve is, by definition, constant, elasticity varies because it measures percentage changes. d) The sign ificance is twofold. (1) One cannot tell elasticity by looking at a demand curve because the elasticity changes over the range of the curve. (2) The elasticity of demand for any product will depend on the level of its initial price and quantity, not just on the change in price. Therefore, the demand for a product may be very elastic in one price range (generally the higher price ranges) and very inelastic in another (lower) price range page 3 WRITE [11] What is the formula for measuring the price elasticity of supply? Suppose the price of apples goes up from $20 to $22 a box. In direct response, Goldsboro Farms supplies 1,200 boxes of apples instead of 1,000 boxes. Compute the coefficient of price elasticity (midpoints approach) for Goldsboro’s supply. I t its supply elastic, or is it inelastic? Ans: Es = percentage change in quantity supplied / percentage change in price. Using the midpoint formula, Es =
1.91 {= (200/[(1000+1200)/2] / 2/[(20+22)/2]} Supply is price elastic (Es�1). CONSIDER [8] Wha t are the major determinants of price elasticity of demand? Use these determinants and your own reasoning in judging whether demand for each of the following products is elastic or inelastic: (a) bottled water, ( Elastic, lots of substitutes, luxury goo d as compared to tap water) (b) tooth paste; ( Inelastic, few substitutes, small portion of budget, necessity) (c) Crest toothpaste; ( Elastic, lots of substitutes for this brand of toothpaste ) (d) ketchup, ( Inelastic, few substitutes, small portion of budg et, necessity) e) diamond bracelets; (Elastic, large portion of budget, luxury good) (f) Microsoft Windows operating system. ( Inelastic, few substitutes, necessity) Ans. Determinants are: Substitutability, proportion of income; luxury versus necessity, and time. CONSIDER [12] Suppose the cross elasticity of demand for products A and B is (+3.6) and for products C and D it is ( - 5.4). What can you conclude about how products A and B are related? Products C and D? Ans. A and B are substitutes; C a nd D are complements. CONSIDER [13] The income elasticities of demand for movies, dental services, and clothing have been estimated to be +3.4, +1.0, and +0.5 respectively. Interpret these coefficients. What does it mean if the income elasticity coeffi cient is negative? Ans: All are normal goods — income and quantity demanded move in the same direction. These coefficients reveal that a 1 percent increase in income will increase the quantity of movies demanded by 3.4 percent, of dental services by 1.0 p ercent, and of clothing by 0.5 percent. A negative coefficient indicates an inferior good — income and quantity demanded move in the opposite direction. page 4 WRITE: The table to the right shows prices and annual quantity demanded of widgets when average incom e of consumers is $40,000/year and when it is $60,000/year. a. Assuming consumers have an income of $40,000/year, use the mid - point formula to determine own - price elasticity of demand for price cuts from: (i) $20 to $16; (ii) $16 to $12; (iii) $12 to $8; (iv) $8 to $4. b. Again assume income of $40,000 and assume there is a single supplier of the product. Would the supplier b e indifferent between a price of $
16 and a price of $12/unit? Explain your answer. c. At a price of $16, what is the income elasticity of demand for an income increase from $40k to $60k? d. Are widgets normal goods or inferior goods? How do you know? e. Assuming consumers have an income of $60k, what is the own price elasticity of demand for a price cut from $16 to $12? Compare this to your answer to a. (ii). Can you explain the difference? a. At an income of $40,000, when price is cut from $20 to $16, quantity demanded increases from 40 to 60 units. Use the midpoint formula. Percentage change in price is: ( - 4)/[(20+16)*(1/2)] = ( - 4)/(18) = - 22% Percentage change in quantity is: (20)/[(40+60)*(1/2)] = (20)/(50) = 40% Own price elasticity of dem and = ( - 1)*[(40%)/(22%)] = 1.8 Income of $40k 20 to 16 16 to 12 12 to 8 8 to 4 % change in price - 22% - 29% - 40% - 67% % change in quantity 40% 29% 22% 18% elasticity 1.80 1.00 0.56 0.27 b . Total revenues are the same at a price of $16 or $ 12 for the seller (i.e, total revenues = price x quantity = $960 at both prices). However, at $16 the firm sells 60 units but at $12 it sells 80 units. Presumably it costs more to produce 80 units than 60 units. The firm is interested in maximizing net revenues (profits) not total revenues. Therefore it would prefer a price of $16 (lower costs but the same revenue). c. At a price of $16 and an income of $40k, quantity demanded is 60. If income increases to $60k, demand at this price increases to 70 un its. % change in quantity demanded = 10/(.5)(60+70) = 10/65 = 15.4% % change in income = 20,000/(.5)(40,000+60,000) = 2/5 = 40% income elasticity = 15.4/40 = .385 d. Widgets are normal goods because the income elasticity of demand is positive. e. % change in price = - 4/(.5)(16+12) = - 4/14 = - 28.6% % change in quantity demanded = 20/(.5)(70+90) = 20/80 = 25% own price elasticity = ( - 1)(25%/28.6%) = .87 For this price change, demand is less elastic at an income of $60k than at $40k. This makes sen se bec ause, ceteris paribus, the smaller the portion of the budget spent on widgets, the less elastic is demand. Price Quantity Demanded Income $40k Quantity Demanded Income $60k $20 40 50 $16 60 70 $12 80 90 $8 100 110 $4 120 140