
Daniel Kling amp Andreas Tillmar danielklingrmvse andreastillmarrmvse Agenda 10am12pm Small ForenSeq ICMP panel Markers Typing technology Statistical concepts of relevance ID: 926654
Download Presentation The PPT/PDF document "Expanded marker panels (Part 2)" is the property of its rightful owner. Permission is granted to download and print the materials on this web site for personal, non-commercial use only, and to display it on your personal computer provided you do not modify the materials and that you retain all copyright notices contained in the materials. By downloading content from our website, you accept the terms of this agreement.


Slide1
Expanded marker panels (Part 2)
Daniel Kling & Andreas
Tillmar
daniel.kling@rmv.se
andreas.tillmar@rmv.se
Slide2Agenda 10am-12pm
«Small»
(ForenSeq, ICMP panel)
Markers
Typing technology
Statistical concepts of relevance
Statistical evaluation/interpretation
«Large»
(Microarray, WGS, other >100K markers
)
Markers
Typing technology
Statistical concepts of relevance
Statistical evaluation/interpretation (incl genetic genealogy
)
Discussion
Slide3Large panels
>10k markers (generally >100k markers)
Markers are mainly SNPsCovers the whole genome
Markers can be associated to phenotypic traits
We can use imputation to get even more data
We can phase data
Slide4Technologies
Typing and bioinformatics
Slide5Sequencing
Microarray (chip)
+ Cheap (probably <$50)+ Used by 23andMe, Ancestry.com
- «Huge» amount of DNA
Expensive ($1000-$2000)
Low coverage
-
B
ioinformatics
!
+ Minute amounts of DNA
+ Base pair information (coverage)
Slide6Microarrays in brief
Commercial chips (
mainly
Illumina
and
Affymetrix
)
Up to millions of
SNPs
Calling is
based
on
intensities
Typically
used
for
good
quality
reference
samples
Price as
low
as $30
per
sample
Slide7Microarrays in brief
Microarrays
can
be
used
on
samples
with
less
than
1
ng/ul
of DNA
Slide8Microarrays in brief
Example
output
Homozygote genotype AA
Slide9Whole genome sequencing in brief
Amplification
of the
entire
genome
(
fragmented
)
Sequence
everything
!
Sequenced
on
NextSeq
or
NovaSeq/HiSeq
Typically
30X (
average
)
coverage
Genotypes
are
called
based
on reads
Data
for areas of
interest
(
SNPs
,
STRs
etc
)
can
be
extracteed
Slide10Whole genome sequencing in brief
Example
output
Chr1:55518316 (rs2483205)
Base
Reads
Avg
quality
A
1
0
C
10
36
G
0
-
T
15
36
Genotype
is C/G
Slide11Capture sequencing in brief
Amplification
of the
entire
genome
(
fragmented
)
Capture
and
sequence
areas of
interests
(
SNPs
,
STRs
etc
)
Can be
sequenced
on
MiSeq
and/or S5
Coverage
depending
on
size
of
capture
panel
Amplicon
or
Hybrydization
based
Bioinformatics
similar
to WGS
Slide12Probabilistic genotyping
Conditional
genotype
probabilities
Pr(
CC|observations
)=0.05
Pr(
CT|observations
)=0.9
Pr(
TT|observations
)=0.05
Others < 0.0001
Base
Reads
Avg
quality
A
1
0
C
10
36
G
0
-
T
15
36
Slide13Inferense of relationships
Methods and approaches
Slide14Brief genetics
Physical
location
(
bp
)
Genetic
location
(
cM
)
Chr1
rs12564807
rs7538305
rs3131972
rs12124819
Marker
bp
cM
rs12564807
734462
0.7
rs3131972
752721
0.8
rs12124819
776546
0.85
rs7538305
824398
0.98
Slide15Brief genetics
Physical
location
(
bp
)
Genetic
location
(
cM
)
Chr1
rs12564807
rs7538305
rs3131972
rs12124819
Marker
bp
cM
rs12564807
734462
0.7
rs3131972
752721
0.8
rs12124819
776546
0.85
rs7538305
824398
0.98
Markers rs12564807 and rs7538305
are separated by 89 936 base pairs,
The genetic distance is 0.18 cM
Slide16Brief genetics
Physical
location
(
bp
)
Genetic
location
(
cM
)
Both
measures
can
be
used,”cM
location
”
informs
us
of
how
linked markers are in
statistical
calculations
whereas
”
bp
location
”
informs
us
where
in the
genome
markers are
located
.
Slide17Identity of alleles
Identical
by
state
(IBS)
Identical
by
descent
(IBD)
S1
M
F
S2
M1:
A
/
a
M1:
A
/
a
M1:
A
/
a
M1:
A
/
a
Zero
alleles
IBD,
two
IBS
Slide18You
share
only
about
0.8% of your DNA with your
Third
cousins
(3C)
So
if
we
have
100 STR markers,
they
would
share
an
allele
in 1 of
those
Slide19Relationships
Note
: S2-2 has the same number
of
generation as S1-3
Slide20Methods to
infer relationships
Key points
LR compares two hypotheses
Segment measures length of half-identical streches
IBS uses shared alleles to infer IBD
Slide21We are looking for a way to infer the degree of relationship (or the most likely degree) based on observed DNA data (IBS)
Slide22Likelihood ratio
Compares two hypothesesComputes a probabilityRelies on estimates of allele frequenciesCan detect rare alleles shared through ancestrySensitive to linkage and LD
Requires computer-intense statistical models
Slide23Likelihood ratio
Potential of likelihood ratiosFalse positives
More markers = higher chance of conclusion
and more false positives
Slide24IBS (KING)
Computes two measures of relatednessKinship coeffecient = Pr(one allele IBD)/4+Pr(two alleles IBD)/2Probability of zero alleles IBDMeasures relies on averaging over a large number of markers
Partly relies on allele frequenciesGenerally robust with mixed ancestryDoes not differentiate very well for distant relatives
Can distinguish relationships up to first cousins
Slide25Segment
Computes the total length of shared DNARequires two different parameters (or more)Minumum length of segmentTotal number of SNPs in a segmentRelies on dense panels (>500 SNPs per 5 cM required)
Completely insensitive to population (?)Can be extended for more complex variations
Slide26Total cM is approximately 3490 cM (see parent child)
Why full siblings only 2613 cM?
Important: Numbers are based on IBD calling algorithms of the tests performed.
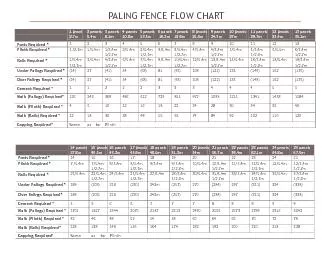
Slide27Worked example
A G A T C GA G A T T G
A G A T T C
A G A T T C
Forensic sample
Putative relative
Segment starts
Segment stops
How long is the segment and how many SNPs?
Slide28Worked example
A G A T C GA G A T T G
A G A T T C
A G A T T C
Forensic sample
Putative relative
Segment starts
Segment stops
Close relationships have many long segments
Distant relationships have few and short segments
Slide29Worked example
Rule of thumbs5-7 cM500-700 SNPsRequires dense SNP panels!
Slide30Worked example
We accumulate the segment’s length
SegmentChromosome
SNPs
Length
1
1
555
8 cM
2
1
6542
50 cM
...
..
..
..
23
22
1400
20 cM
Total
.
.
430 cM
Slide31430 cM is the average sharing of the highlighted relationships
But
, falls within the range of several others!
Slide32LR
Segment
IBS (KING)Single markers
Can be
very
informative
Uninformative
Can
provide information
Many
makers
Pruning
needed
EssentialPartly
essential
Allele
freqs
Very
useful
Not
used
(
generally)
Used to a certain degree
Linkage/recombCan be used!Essential
Not usedLDA problem
Minor
issue
Minor
issue
?
Population
Sensitive
InsensitivePartly sensitiveStatisticsFull modelAd-hocTheory of large number of markers
Slide33Phasing and imputing
Improve and extend the raw data
Slide34Phasing
Assigns maternal/paternal chromosomesInstead of unordered genotypes -> ordered genotypes Recall half-identical stretchesImprovement with regards to finding ”true” IBD segments
Complex statistical modelInduce ”errors”Used in simulations
Slide35Phasing - Example
Individual
1Individual 2
SNP 1
A/G
A/A
SNP 2
C/T
C/T
SNP 3
C/G
G/G
Unordered
genotypes
Slide36Phasing - Example
Individual
1Individual 2
SNP 1
A|G
A|A
SNP 2
C|T
T|C
SNP 3
C|G
G|G
Ordered
genotypes
Slide37Phasing - Example
Individual
1Individual 2
SNP 1
A|G
A|A
SNP 2
C|T
T|C
SNP 3
C|G
G|G
Individual
1
Individual
2
SNP 1
A/G
A/A
SNP 2
C/T
C/T
SNP 3
C/G
G/G
Share
an
allele
for
each
marker
No
sharing
of
haplotypes
Slide38Phasing - Example
Individual
1Individual 2
SNP 1
A|G
A|A
SNP 2
C|T
T|C
SNP 3
C|G
G|G
Individual
1
Individual
2
SNP 1
A/G
A/A
SNP 2
C/T
C/T
SNP 3
C/G
G/G
Share
an
allele
for
each
marker
No
sharing
of
haplotypes
Error
?
Slide39Phasing - Example
Individual
1Individual 2
SNP 1
A|G
A|A
SNP 2
C|T
T|C
SNP 3
G|C
G|G
Individual
1
Individual
2
SNP 1
A/G
A/A
SNP 2
C/T
C/T
SNP 3
C/G
G/G
Share
an
allele
for
each
marker
Sharing
of
haplotype
!
Slide40Phasing – Worked example
Individual
1Individual 2
Individual
3
Individual
4
SNP 1
A/G
A/G
A/A
G/G
SNP 2
C/T
C/T
C/C
T/T
SNP 3
C/G
G/G
G/G
C/C
Slide41Phasing – Worked example
Individual
1Individual 2
Individual
3
Individual
4
SNP 1
A/G
A/G
A|A
G|G
SNP 2
C/T
C/T
C|C
T|T
SNP 3
C/G
G/G
G|G
C|C
Step 1
Slide42Phasing – Worked example
Individual
1Individual 2
Individual
3
Individual
4
SNP 1
A/G
A|G
A|A
G|G
SNP 2
C/T
C|T
C|C
T|T
SNP 3
C/G
G|G
G|G
C|C
Step 2
Slide43Phasing – Worked example
Individual
1Individual 2
Individual
3
Individual
4
SNP 1
A|G
A|G
A|A
G|G
SNP 2
C|T
C|T
C|C
T|T
SNP 3
G|C
G|G
G|G
C|C
Step 3
Slide44Imputing
Raw data may contain locus dropouts or be incompleteImputing means assigning a genotypeUse complex algorithmsUse known data from large reference panelsInduce genotyping errors
Important strategy for gaining denser panels of markersSNP profiles may be imputed from STR markers
Slide45Imputing - Example
Individual
1Individual 2
SNP 1
A/G
A/A
SNP 2
C/T
-/-
SNP 3
C/G
G/G
Missing
data
Slide46Imputing - Example
Individual
1Individual 2
SNP 1
A|G
A|A
SNP 2
C|T
-/-
SNP 3
C|G
G|G
Pre-phasing
Slide47Imputing - Example
Individual
1Individual 2
SNP 1
A|G
A|A
SNP 2
C|T
G|G
SNP 3
C|G
G|G
Imputation
Slide48Errors
What happens with ”bad” data
Slide49Effect of
errors
Induce errors to one of the genotypes! Three types of errors:
Homozygote -> Heterozygote
Heterozygote -> Homozygote
(Homozygote -> Homozygote)
Slide50Effect of
errors
Pr(
Homozygote
|
Heterozygote
)=0.1
True
relationship
Slide51Effect of errors
Decreasing DNA amount
Slide52Effect of errors
Segments are reduced to smaller ones
Slide53Genetic genealogy
Brief background
Slide54Genetic genealogy (in forensics)
1.
Identify
traces
2.
Genome
analysis
3. Mask DNA
profile
4.
Search
GEDmatch
5.
Genealogical
records
6.
Investigations
AGCTTGCTAGCTGATCGATGCTAGCTA…
GATCGATGCTGATCGGATAATGCTGAT…
A
G
CTTG
C
TAG
C
TGA
TC
GATG
CTA
GC
T
A…
G
A
TCGA
T
GCT
G
ATC
GG
ATAA
TGC
TG
A
T…
Slide55Order test
Spit in a cup
Results
Slide56Popularity of
genealogy companies
Slide57Rawdata
GEDmatch
No
genetic
testing
Anonymous
«
Free
»
Compare
Accepts only data from these companies
Slide58Golden State killer
>50 rapes, >12 murders, >100 burglaries
Slide59Who are her 3rd cousins?
3rd
cousins
2nd
cousins
1st
cousins
Perpetrator one of them!
Slide60Golden State killer
One (or more) of his 3rd cousins had their profiles in GEDmatch!
Slide61Genetic genealogy
Contribution from forensic
geneticsExtracting DNA
Producing
a ”reliable” DNA
profile
Transfer the
profile
to
genealogist
Work of the
genealogist
(or
law enforcement
)Upload DNA profile to
database
Genealogy
work
Work of
law
enforcement
Investigative
work on
leads
Find
suspectsSTR
profile comparison
Slide62Discussion
Benefits with large marker panelsPros and cons with the different statistical methods
Implementation in forensics
Slide63Expanded marker panels (Part 2)
Daniel Kling & Andreas
Tillmar
daniel.kling@rmv.se
andreas.tillmar@rmv.se