
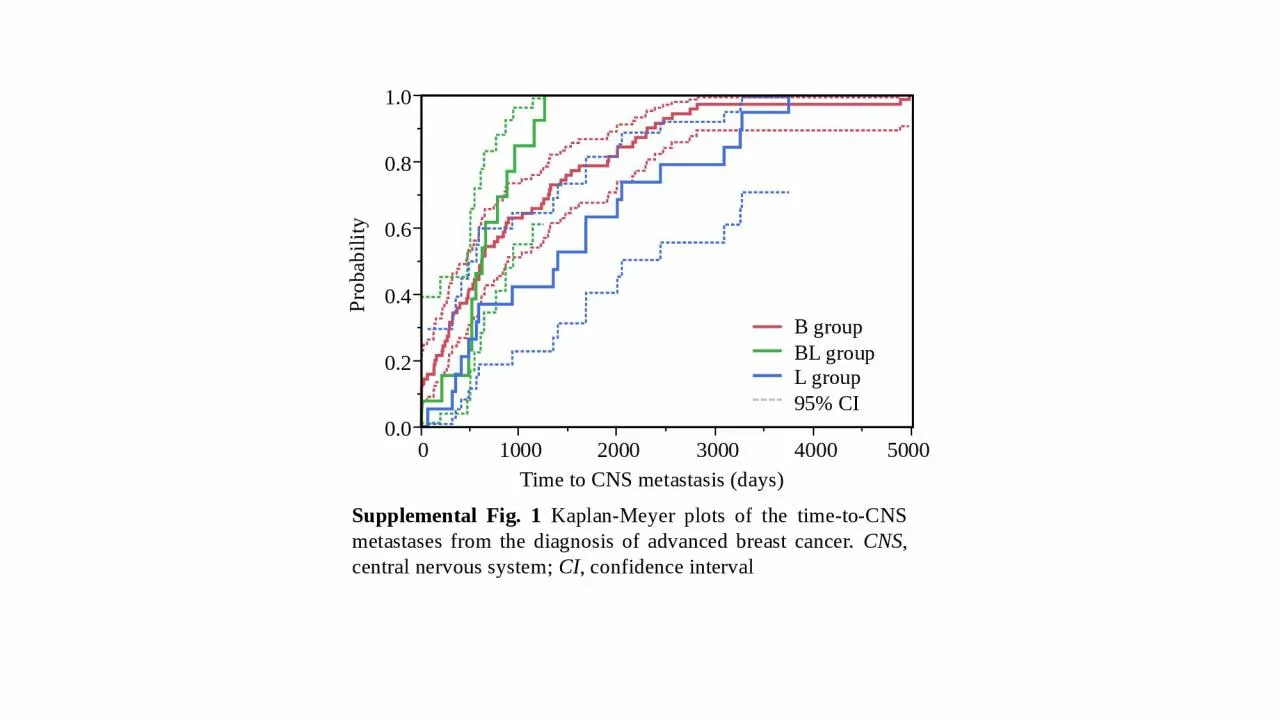
1000 2000 3000 4000 5000 Time to CNS metastasis days B group BL group L group 95 CI 0 Supplemental Fig 1 KaplanMeyer plots of the timetoCNS metastases from the diagnosis of advanced breast cancer ID: 1044039
Download Presentation The PPT/PDF document "0.0 0.2 0.4 0.6 0.8 1.0 Probability" is the property of its rightful owner. Permission is granted to download and print the materials on this web site for personal, non-commercial use only, and to display it on your personal computer provided you do not modify the materials and that you retain all copyright notices contained in the materials. By downloading content from our website, you accept the terms of this agreement.


1. 0.00.20.40.60.81.0Probability10002000300040005000Time to CNS metastasis (days) B group BL group L group 95% CI0Supplemental Fig. 1 Kaplan-Meyer plots of the time-to-CNS metastases from the diagnosis of advanced breast cancer. CNS, central nervous system; CI, confidence interval
2. 0.00.20.40.60.81.0Provability01000200030004000500060007000Time from the diagnosis of ABC (days) B group BL group L group No CNS metastasesSupplemental Fig. 2 Kaplan-Meyer plots of the overall survival from the diagnosis of advanced breast cancer. CNS, central nervous system; ABC, advanced breast cancer