
Tomomi Suwa and Liz Schultheis GK12 Workshop Session Diversity Productivity Coexistence Nutrients and Productivity Proteins enzymes metabolic processes part of chlorophyll Plants grow larger ID: 1026315
Download Presentation The PPT/PDF document "What to do with all our data?" is the property of its rightful owner. Permission is granted to download and print the materials on this web site for personal, non-commercial use only, and to display it on your personal computer provided you do not modify the materials and that you retain all copyright notices contained in the materials. By downloading content from our website, you accept the terms of this agreement.


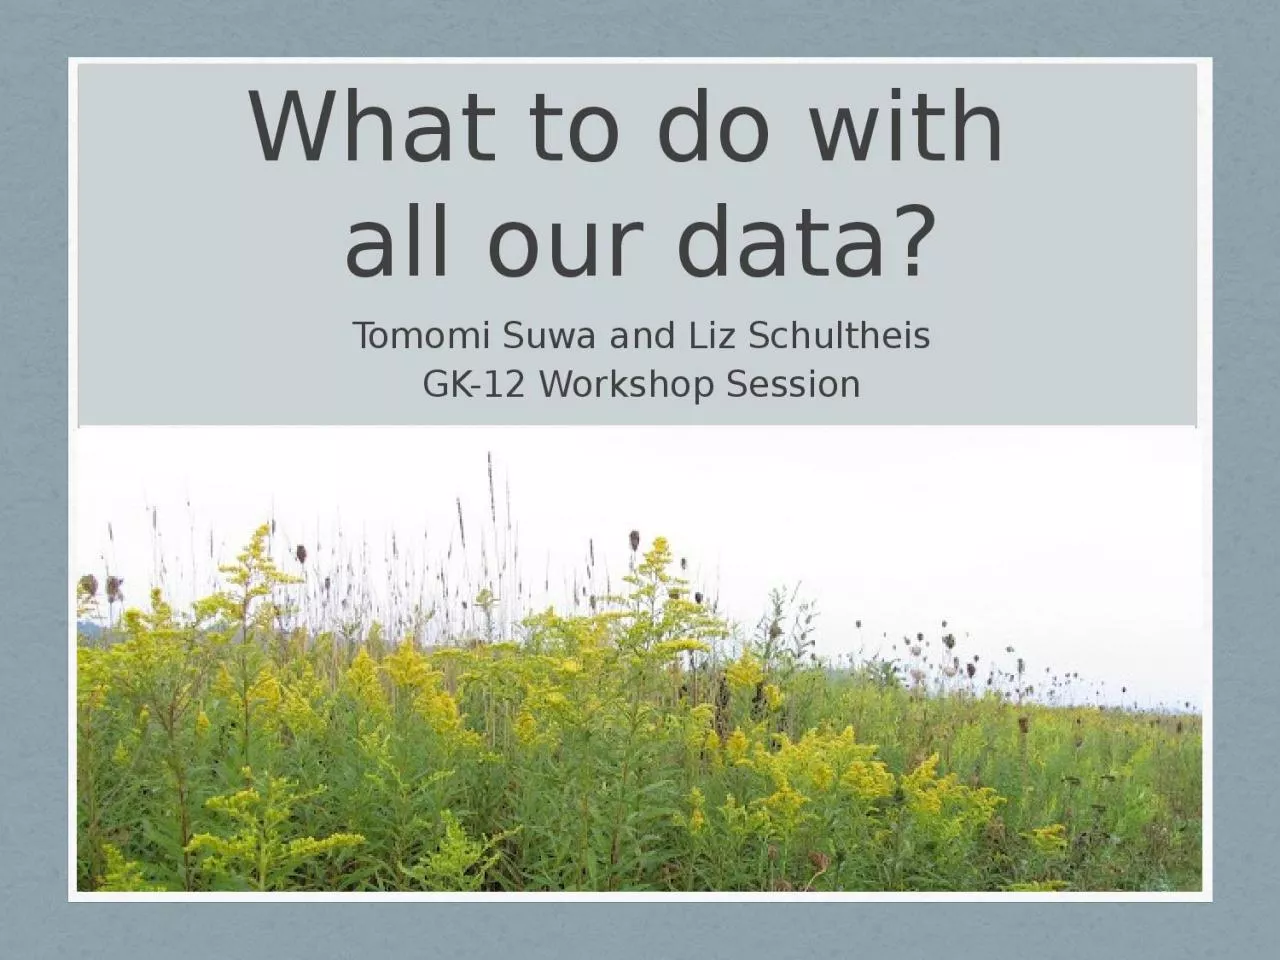
1. What to do with all our data?Tomomi Suwa and Liz SchultheisGK-12 Workshop Session
2. DiversityProductivityCoexistence
3. Nutrients and Productivity
4. Proteins, enzymes, metabolic processes, part of chlorophyllPlants grow larger and produce more seeds and fruits
5. Nutrients and Productivity in Plant Functional GroupsWhile plants benefit from fertilization, not all plants will benefit to the same extent.
6. Nutrients and Productivity in GrassGrass species are notorious for needing high levels of nitrogen fertilizersThey grow quickly and are browsed commonly by insects and mammals
7. Nutrients and Productivity in LegumesLegume plants have rhizobia bacteria living in their roots, helping them fix nitrogen
8. Nutrients and Productivity in ForbsForbs = broad leaved, non-woody non-grass species. Commonly found in old fields and meadows.Forbs are a very diverse and variable group of plantsSome forbs have high nitrogen requirements, while other require very little
9. Nutrients and DiversityIf fertilization affects different groups of plants in different ways, what do you predict fertilization will do to species richness (# species)?
10. Our Questions:How does nutrient addition affect diversity and productivity?Does nutrient addition affect diversity and productivity of groups of plants in different ways?GrassesLegumesForbs
11. Experimental design of schoolyard plots parallels the T7 treatment at the KBS LTER.Successional fields with a diversity of grass, legume, and forb species.Nitrogen fertilizer addition treatment.
12. Every year collect subset of biomass to determine plant productivity.Measure the diversity of species.
13. What are the equivalent treatments in the BEST plots?How does fertilization affect diversity/productivity?
14. LTER Data Set5 sheetsRaw dataRichness 2003 DataBiomass 2003 DataRichness over time (1989-2003)Biomass over time (1989-2003) Go to excel spread sheets:
15. What specific questions can we ask?
16. Our Question:Do grasses and legumes respond differently to N addition? What do you predict? -richness -biomassWe’ll address this question as a group!
17. Do grass and legume respond differently to N addition? Break into 4 groupsGrass RichnessGrass BiomassLegume RichnessLegume BiomassForb BiomassOur Question:
18. No N AdditionN Additione.g. How did forbs respond to Nitrogen addition? Forb Biomass (g)SESEAverage
19. To calculate Standard Error (SE):-Two-step process=var (A1:A6)=sqrt (var(A1:A6))/# replicates)
20. Let’s go to Excel and graph the dataData from year 2003
21. No N AdditionN Additione.g. How did forbs respond to nitrogen addition? Forb Biomass (g)How can we tell the difference??
22. Analyze the data with T-testUsed to determine if two groups are considered different
23. P-valueThe p-value tells whether or not two groups are differentN-N +If p ≤ 0.05, two groups are differentIf p > 0.05, two groups are NOT differente.g. p=0.013
24. Let’s go to Excel to do t-test!4 groups: Grass Richness Grass Biomass Legume Richness Legume Biomass
25. What did you find?
26. Graphs: Richness and Biomass 2003GrassLegumeRichnessBiomass (g)
27. Does the effect of N fertilization change over time?
28. e.g. forb biomassForb biomass (g)Year
29. Does effect of N change over time? Is this pattern real??Forb biomass (g)Year
30. Does effect of N change over time? Plot scatter graphIs this pattern real??r = -0.50P = 0.06r = -0.24P = 0.39Forb biomass (g)
31. What did you find?
32. Richness and Biomass 1989-2003RichnessBiomassGrassLegume
33. Do grasses and legumes respond differently to N addition? How does N addition affect richness and productivity? ( or )Each group fill the tableRichness 2003Biomass 2003RichnessOver time Biomass Over timeGrassLegume
34.
35.
36. Comments/questions?
37. Richness 2003Biomass 2003RichnessOver time Biomass Over timeGrass00-+Legume-0--
38. Functional Group RichnessData from year 2003