
Katherine McCaffrey PhD Candidate FoxKemper Research Group Department of Atmospheric and Oceanic Sciences Cooperative Institute for Research in Environmental Sciences 1 Thank you to my advisor and collaborators ID: 1012327
Download Presentation The PPT/PDF document "Characterizing Turbulence at a Prospecti..." is the property of its rightful owner. Permission is granted to download and print the materials on this web site for personal, non-commercial use only, and to display it on your personal computer provided you do not modify the materials and that you retain all copyright notices contained in the materials. By downloading content from our website, you accept the terms of this agreement.


1. Characterizing Turbulence at a Prospective Tidal Energy Site: Observational Data AnalysisKatherine McCaffreyPhD Candidate, Fox-Kemper Research GroupDepartment of Atmospheric and Oceanic SciencesCooperative Institute for Research in Environmental Sciences1Thank you to my advisor and collaborators:Baylor Fox-Kemper, Dept. of Geological Sciences, Brown University, CIRESPeter Hamlington, Dept. of Mechanical Engineering, CU BoulderJim Thomson, Applied Physical Laboratory, Univ. of Washington
2. OutlineIntroduction to Tidal EnergyIntroduction to the ProblemAnisotropy, Coherence, and IntermittencyObservations and MetricsParameterization ResultsPreliminary Statistical Model Results2
3. Tidal Energy ResourceClean, renewable, predictable energy source; close to population centersDOE Resource Assessment: potential 250 TWh/year electricity generation (~6% of US usage)3http://www.tidalstreampower.gatech.edu/
4. Tidal Energy Conversion TechnologyBarrages - use pressure differences on either side of a damIn-Stream Turbine – in the flow, invisible from surfacehttp://www.infoniac.com/environment/world-s-biggest-tidal-turbine-to-be-built-in-scotland.htmlhttp://www.darvill.clara.net/altenerg/tidal.htmhttp://www.theecologist.org/News/news_analysis/67808how_france_eclipsed_the_uk_with_brittany_tidal_success_story.htmlRance, France – first and largest tidal barrage in the world: 240 MW4
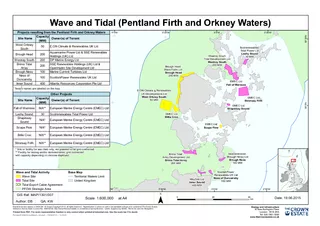
5. Where are we now?Bay of Fundy – successes and setbacksEuropean Marine Energy Centre, Orkney, Scotland test centerThorough site characterizations at Admiralty Inlet and Nodule Point, Puget Sound, WA5
6. Learning from WindTurbulence effects on power production: turbulence intensityTurbulence effects on turbine mechanics (loads and subsequent gear box failures): coherent turbulent kinetic energyKaiser et al 2007Kelley et al 20056Wind speedPowerRed – CTKEBlue – Dynamic PressureTime (seconds)Local Relative Energy FluxLocal Dynamic Pressure ResponseLocal CTKE Excitation
7. GoalsTake the knowledge and experiences of the wind energy industry to further the development of tidal energy, focusing on turbulence.Do a thorough physical description of the turbulence that will affect a tidal turbineSite classification for decision-makingDescribe realistic turbulence with metrics that can be used to improve modelsTurbulent in-flow generators: National Renewable Energy Laboratory’s TurbSim/pyTurbSimTidal Array scale: ROMSTurbine scale: LES7
8. Nodule Point, Puget Sound, WA8LatitudeN 48 01.924’LongitudeW 122 39.689’Depth22mDatesFeb 17-21, 2011Sampling Frequency32 HzNoise0.02 m/sProposed Hub Height4.7mHub Height Max. Velocity1.8 m/sThomson et al, 2012
9. Turbulence MetricsTurbulence Intensity:Coherent Turbulent Kinetic Energy:9Mean u (m/s)Iu (%)StDev u (m/s)
10. Anisotropy Tensor Invariants:CTKE-like, but built from invariants: Anisotropy MagnitudeIndependent of chosen coordinate system10All real flows fall somewhere in this triangleTurbulence MetricsThree component limitOne component limitTwo component limit
11. Physical TurbulenceWhat physical features are there to turbulence?Size – how big? The size of the turbine? Larger? Smaller?Frequency – how often do these “events” happen?Shape – flat, pancake-like? 3-dHow do we measure these?Coherence – how long is the flow correlated?Intermittency – how “random” is the flow? Anisotropy – how many velocity components contribute to the fluctuating velocity?11
12. CoherenceTemporal AutocorrelationIntegral ScaleTaylor Scale12τ (seconds)R(τ) (%)Λ=10.13 secλ=0.08 sec
13. IntermittencyIntermittency manifests itself in departures from a normal distribution in the probability density function of velocity differences.13Pdfs of the velocity perturbation differences, ∆u’ (circles), ∆v’ (squares), and ∆w’ (diamonds), with Gaussian curves for reference (dashed). Black shapes have a time step of ∆t = 1 (~3 cm), gray are ∆t = 115 (~3 m), and white are ∆t = 230 (~6 m).Higher order moments support the lack of Gaussianity in the pdfs.MeanKurtosisSkewnessStandard DeviationΔu/σProbability
14. AnisotropyImprovement to the anisotropy analysis: For eigenvalues, λi, of the anisotropy tensor, aij, ordered from greatest to least, the barycentric coordinates are defined by: 14Banerjee et al 2007C1c : one-component limit – linearC2c : two-component limit – planarC3c : three-component limit – isotropicThree component limitTwo component limitOne component limit
15. ParameterizationHow do we represent how “turbulent” a location is?Often turbulence intensity is all that is usedWhat about intermittency, coherence, and anisotropy?15 Mean u (m/s)Iu (%)A (m2/s2)A (m2/s2)CTKE (m2/s2)
16. Parameterization: Shape16Iu only measures one component (u)A (m2/s2)The highest instance of each parameter (large shapes) is close(r) to the one-component limit. Iu (%)CTKE (m2/s2)A is better than CTKEThreeOneTwo
17. Parameterization: SizeλΛIu0.5960.450CTKE0.6800.017A0.8840.31717The anisotropy magnitude, A, captures the the behavior of CTKE (and therefore loads?), intermittency in the pdf, the shape from the barycentric map, and the coherence of the correlation function. A (m2/s2)λ (seconds)
18. ConclusionsA new, tensor-invariant metric for physically describing turbulence, the anisotropy magnitude, is introducedTurbulence intensity does not parameterize intermittency, coherence, or anisotropy as well as other easy-to-measure metrics such as CTKE and A.The anisotropy magnitude does the best job at representing intermittency, coherence, and anisotropy.If A is similar to CTKE, does it have the same strong correlation to turbine loads?How well does the coherence function in pyTurbSim represent the observations in terms of A?18
19. Next step…The NREL pyTurbSim model (Jonkman & Kilcher) creates stochastic turbulence.The NCAR LES model (Sullivan et al.) includes more realistic ocean physics.19J. Jonkman, L. Kilcher, TurbSim user’s guide: Version 1.06. 00, Golden, CO: National Renewable Energy Laboratory (2012).P. P. Sullivan, J. C. McWilliams, C.-H. Moeng, A subgrid-scale model for large-eddy simulation of planetary boundary-layer flows, Boundary Layer Meteorology 71 (1994) 247–276.How well do the models do at generating realistic turbulence? How do the statistics calculated from the model output compare to those from the observations?
20. Introduction to pyTurbSimStochastic turbulence generatorInputs: Background mean flow profileSpectral density curveTurbulence intensity and Reynolds stressesMethod:Inverse fast Fourier transformOptional additional spatial coherence functionOutputs:Three-component velocity time series20Model InputLatitude48NDepth (RefHt)22mUref1.8 m/sSampling Frequency (timestep)10 HzHub Height4.7m___________________u’w’.0011 m2/s2__________________u’v’.0009 m2/s2_____________________v’w’.0004 m2/s2Turb ModelTIDALProfile TypeH2L (log)
21. ‹#›
22. Preliminary ResultsBaseline statistics, before coherence is added22A (m2/s2)Iu (%)CTKE (m2/s2)CTKE (m2/s2)A (m2/s2)
23. Thank you!Stay tuned for model results at the Boulder Fluid Seminar December 10th!23