
2 Overview Acoustic positioning system is mandatory for the detector The frequency range of intereset for acoustic positioning is 1040 kHz The freqeuncy range of interest for acoustic neutrino detection is flt80 kHz ID: 908028
Download Presentation The PPT/PDF document "G. Riccobene Acoustic positioning system..." is the property of its rightful owner. Permission is granted to download and print the materials on this web site for personal, non-commercial use only, and to display it on your personal computer provided you do not modify the materials and that you retain all copyright notices contained in the materials. By downloading content from our website, you accept the terms of this agreement.


Slide1
G. Riccobene
Acoustic positioning system for NEMO phase II
Slide22
Overview
Acoustic positioning system is mandatory for the detector
The frequency range of intereset for acoustic positioning is
10-40
kHz
The freqeuncy range of interest for acoustic neutrino detection is f<80 kHzHydrophones are large bandwidth sensors We can use the same sensors for both goalsAll data to shore data rate fully sustainable with NEMO-like electronicsThe array must be calibrated in amplitude and time (OK for the NEMO-like DAQ system)
Slide3Ambient noise definition and spectra
Ambient noise is generally made up of three constituent types:
wideband continuous noise, tonals and impulsive noise
Impulsive noise:
transient, wide bandwidth and short duration. It is best characterised by quoting the peak amplitude and repetition rate.
Continuous wideband noise:
normally characterised as a spectrum level (in a 1 Hz bandwidth) intensity in dB relative to a reference level of 1µPaTonals: very narrowband signals, usually characterised as amplitude in dB re 1µPa and frequency. turbolence
tides
shipping
sea surface
Urik
Knudsen
Slide44
Acoustic positioning in NEMO-Phase 1
In
NEMO Phase
1 a commercial acoustic positioning system was used (ACSA
).
Acoustic poisitionig board with DSP onboard: acoustic signal analysis underwater detection time sent to shore to recover hydrophone position.
GPS Time packet
Signal detection time
Acoustic
positioning PC
Acoustic
positioning board
200 kHz digitization
Beacon Long Base Line
15 m
300 m
Beacon
Slide55
Acoustic positioning Long Baseline (NEMO Phase 1)
Beacon
Beacon
Beacon
On Junction Box
350 m
350 m
350 m
Mini Tower with 4 floors
8 acoustic receivers
and a monitoring station
Battery
Battery
Beacon
Battery
Beacon
On Tower
Distances between beacons were calculated with ROV and GPS
e.o. cable
350 m
e.o. cable
Slide66
BEACON
TOWER BASE
BEACON
BEACON
BEACON
SYNCHRONIZATION
MEASUREMENTS
Acoustic positioning: Measurement Principle
Hydrophone
Times are syncrhonized
The monitoring station is still on the sea-bed
Resolution ~15 cm
Slide77
ACSA TSSC Patent
Delay time from monitoring station time
time
Beacon TSSC code
A custom code based on TDOA recovers hydrophone position
Sound velocity profile recoverd from CTD
Slide8Measured distance in laboratory
= 14.25 m
Mean value
= 14.24 m
Calculation of distance beetween H0-H1 on Floor 2
(each point is averaged in 5 minutes)
Performances of the system
Slide9G. Riccobene, CM LNS, 18 December 2008
NEMO - Phase 2
9
Acoustics in NEMO Phase 2
750 m
40 m
NEMO Phase II: Installation and operation of a “full scale” tower in Capo Passero Site
16 floors, 64 Optical Modules, 750 m total height
Same electronics and DAQ and DAT as NEMO Phase I:
All detectors data synchronised and phased (about 1 nsec)
32 hydrophones used mainly for Acoustic Positioning and also for Acoustic Physics/Biology
Reduce costs and improve reliability of the tower acoustic positioning system
O(1km) long antenna for feasibility studies on acoustic detection
O
ptical and acoustic data in the same data stream with the same timing
Interdisciplinary
Environment and Detector acoustic monitoring
10 m
2 PMTs, 1 hydrophone
Slide1010
NEMO Phase II – “Acoustic” Electronics Chain
ADC
Floor Conrtol Module
Adds GPS Time
Send data to shore
On-Shore
Floor Conrtol Module
Data Parsing
Acoustic
Physics / Biology
Acoustic
Positioning
Acoustic
Data Server
Hydros +
preamps
OMs
“All data to shore” philosophy data payload: 2 Hydros = 1 OM, fully sustainable
optical
fiber
New design: we use the FCM offshore to time stamp the acoustic data
A “phased and syncronised” acoustic array
Slide1111
The Acoustic Board
The Acou-board consists of a DAQ section and a power supply section
S
ignal from preamp
5 V power supply
FCM interface cable: data, clock reset
ADC Crystal
CS-5381
Max input 2 V
RMS
Preamp power
Slide1212
Tests : noise
floor (AcouBoard and FCM)32000 pts FFT no average
0 dB = 2 V RMS
Slide1313
Hydrophone and Preamplifier
Slide1414
Preamplificatori e idrofono
TOP VIEW
FRONT VIEW
PIN-OUT
A :
NC
B : IN –
C : IN +
1 :
COM
2 :
– OUT
3 :
NC
4 : + OUT
5 :
+ V
Gain
32dB Single Ended
Z
IN
100M
Ω
/40pF
Z
OUT
50
Ω
I
OUT
30mA
Band
4Hz÷150kHz
Equivalent Noise
1 nV/√Hz (f=25kHz, C=2nF)
Distorsion
1% (V
IN
=20mV)
V
IN-MAX
50mVptp
V
OUT-MAX
4Vptp Single Ended
V
ALIM
4÷6 V (80mA)
Slide1515
Test with the whole chain: noise floor
32000 pts FFT no average
0 dB = 2 V RMS
Slide16Measurement of the latency
FMC on-shore
FMC
off-shore
Insert time in data
Optical link
Acoustic Data
acquisition board
Signal
generator
Acoustic
Board
(sampling)
preamp
preamp
Trigger
Signal
(time
known)
Time of trigger known
( accuracy
< ns
)
Latency Measuremnet =
170 us
±
100
ns
For all boards
sinus
Slide1717
Hydrophone Amplitude Calibrations at High Pressure
Commercial Hydrophones
are typically factory calibrated:
piston test at 250 Hz, water pool test above 5 kHz (due to reflections)
directionality patternBut for many hydrophones sensitivity change as a function of pressure (about 10 dB less at 3500 m)NEMO and an italian company (SMID) have developed low cost hydrophones for 4000 m depth, with no change of calibration as a function of depth.NATO has developed for / with NEMO a standard procedure for calibration under pressure
0.1 bar / 30 kHz ping
300 bar / 30 kHz ping
Hydros for NEMO Phase 2 (SMID) don’t show change of sensitivity at 3500 m after several cycles).
Sensitivity (now poor) can be improved
Slide1818
NURC Acoustic calibration facilities
Calibration Tank
Tank dimensions: 4.6m long, 3.6m wide, 2.7m deep
Crane: Wall mounted, 500kg capacity
Rotators:
2 units, 50kg and 500kg capacity, 0.1 degree resolution Instruments: PC with National Instrument PXI 6115 DAQ card & GPIB HP 33120a signal generator interfaced through GPIB bus Stanford Research Systems DG 535 delay generator Stanford Research Systems SRS 560 pre-amplifier Instruments Inc L2 power amplifier
Slide19NURC Tests
Set-up for high pressure tests
Relative Hydrophone sensitivity
variation with hydrostatic
pressure at 20kHz
Hydrophone placed in pressure vessel filled with oil & immersed in a calibration tank
• A projector (ITC1042) is placed at approximately 1m from the pressure vessel• Pressure is increased to 400 bar and allowed to settle for 30 minutes.• Hydrophone signal is acquired at 400, 300 and 50 bar.Calibration curves (32 hydros) in water tank
Slide20Typical Hydrophone Response
Slide2121
“Acoustic” Data transmission Chain
Shore
Sea
INFN
ACSA
Beacon
ACSA
Slide2222
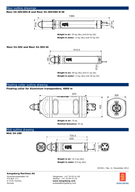
Beacon
ACSA CharacteristicsFrequency:
32 kHz +/- 500 Hz (f may be different for different beacons
)
Pulse
duration: 5 ms +/- 200 µsSource level: 180 dBRepetition rate: programmable TSSC sequence. Approximate rate: 1 HzUltra stable clock embedded – Drift & jitter < 5.10-8
Consumption
:
Inrush
current
: <220mA
Run
mode current : <220mA Pulse
current : <220mAMaximum depth: 3600 m,
External
power supply option activated.
Size
: Diameter: < 10 cm – Length : < 50 cm.
Slide23Simulation of the
positioning system
Base tower Beacon
1
st
floor hydro
Base tower Beacon
1
st
floor hydro
Lateral Beacon
1
st
floor hydro
Lateral Beacon
16
st
floor hydro
Beacon signal at source
32 kHz
Knudsen's relation:
SPD (f
Hz
, SS)
≈ 94,5 – 10 log f
5/3
+ 30 log (SS +1) re μPa
2
/Hz
Slide24Simulation beacon signal
over
Sea Noise
Beacon signal over background
SS= 5
16
th
floor
Correlation of acquired signal with
t
he original beacon signal
Tower base beacon
Other beacons (TSSC)
Slide25Common work with CPPM and Valencia
Free
Flooded Rings
(SX30)
Resonance Frequency
(kHz)
30Transmit Voltage Response, TVR
(dB Ref. 1 µPa/Volt @ 1
metre
)
133
Receive Voltage Response, OCV
(dB Ref. 1 volt/ µPa.)
-183
Useable Frequency Range
(kHz)
20-40
Beam Pattern
Radial
Axial
Omni
Toroidal (60°)
Efficiency
(% min)
50
Input Power
(2% duty Cycle)
300W
Operating Depth
(Metres)
Unlimited
Cable
1N2
Install a couple of recieving/transmitting hydrophones on 1 floor:
The pulse emission time is triggered by the FCM
pulse emission time and pulse reception time on other hydrophones are known with a precision better than 1 usec.
Slide26Search for ceteacens