
4221 Page 1 of 4Information subject t ID: 827647
Download Pdf The PPT/PDF document "PROFILE OF STATISTICAL INDICATORS" is the property of its rightful owner. Permission is granted to download and print the materials on this web site for personal, non-commercial use only, and to display it on your personal computer provided you do not modify the materials and that you retain all copyright notices contained in the materials. By downloading content from our website, you accept the terms of this agreement.


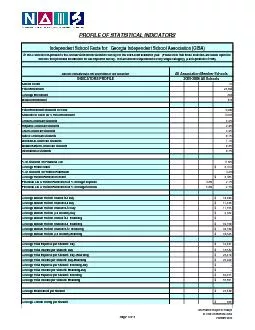
PROFILE OF STATISTICAL INDICATORS$
PROFILE OF STATISTICAL INDICATORS$ $ 4.2%2.1%$ $ $ $ $ $ $ $ $ $ $ Page 1 of 4Information subject to change© 2006 StatsOnline/ NAISFebruary 2006PROFILE OF STATISTICAL INDICATORSINDICATORS PROFILEIndependent School Facts for: Georgia Independent School Association (GISA)47 GISA schools responded to the Annual StatsOnline Statistics Survey for the 2005-2006 academic year. (Please note
that these statistics are based upon the
that these statistics are based upon the schools that provided information for each specific survey. Not all schools responded to every single category). (Last Updated 3/17/06)All Association Member Schools2005-2006 All Schools$ 18.1%$ 64.2%$ 23.1%$ 91.4%$ 93.1%$ 37.8%$ .2%$ 69.3%$ 63.3%$ $ 42.8%$ 41.7%$ 33.%$ 61.2%$ 69.5%$ 51.1%$ 1.%$ 59.5%$ 100.%7092391541146.22.11.41.05.%433100.%262092.%41348.8%14313313442113544260.%291750.%301650.%27
1850.%261840.%2321Page 2 of 4Informatio
1850.%261840.%2321Page 2 of 4Information subject to change© 2006 StatsOnline/ NAISFebruary 2006PROFILE OF STATISTICAL INDICATORSINDICATORS PROFILEIndependent School Facts for: Georgia Independent School Association (GISA)47 GISA schools responded to the Annual StatsOnline Statistics Survey for the 2005-2006 academic year. (Please note that these statistics are based upon the schools that provided information for each specific survey. Not all schools responded to every single category). (Last Updated 3/17/06)All As
sociation Member Schools2005-2006 All Sc
sociation Member Schools2005-2006 All Schools$ $ $ $ $ $ $ $ $ $ $ $ $ $ $ $ $ $ $ $ $ $ $ $ $ $ $ Page 4 of 4Information subject to change© 2006 StatsOnline/ NAISFebruary 20