
KaseBars Kase Bars originally published as Kase Universal Bars in Cynthia Kases 1997 book Trading with the Odds have finally been re leased TradeStation and Bloomberg offer these bars as ID: 854568
Download Pdf The PPT/PDF document "Why Use Them" is the property of its rightful owner. Permission is granted to download and print the materials on this web site for personal, non-commercial use only, and to display it on your personal computer provided you do not modify the materials and that you retain all copyright notices contained in the materials. By downloading content from our website, you accept the terms of this agreement.

1 KaseBars – Why Use Them? Kase B
KaseBars – Why Use Them? Kase Bars, originally published as Kase Universal Bars in Cynthia Kase’s 1997 book Trading with the Odds have finally been re - leased. TradeStation and Bloomberg offer these bars as a chart type. Kase Bars are created by using True Range targets such as 10 cents, 20 points, etc., and uses only real price data. Kase Bars plot like traditional bars and candle - sticks. Because a target range dictates the size of each bar, the bars are all approximately the same size (range) and are not driven by the time or volume on the X - axis. Some bar systems use equal range bars. These bars are created by using an equal high low range, not true range like Kase Bars. Kase Bars are supe rior to equal range bar methods because Kase Bars use equal true range and include any gaps between the previous bar’s close and the current high or low into the bar’s range – as opposed to simple range bars, which only account for the high - low range and l eave out any gaps. Kase Bars also use only real data to form bars, unlike some equal bar methods which use false data to fill in gaps and high/low ranges. Thus, if there are any gaps on the chart, with Kase Bars such gaps are shown, as op - posed to filling the gap by creating bars using counterfeit data. In addition, if the minimum range between two ticks exceeds the target range, the actual minimum range is shown. This is in opposition to some range bar methods, which force bars to the exact target by inse rting false data. For example, if two sequential prices were $10.1 and $10.2, Kase’s method, using a 5 - cent range, does not put in false data but would generate a 10 - cent bar, since that is as close to the target as one can get with real data. Some other m ethods would insert a false tick at 10.15 to break up the 10 - cent bar into two 5’s. Therefore, with Kase Bars, real market gaps will be displayed, such as breakaway, measuring or midpoint, and exhaustion gaps which are imp
2 ortant in anticipating market beh avior,
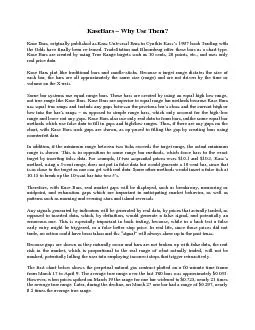
ortant in anticipating market beh avior, as well as patterns such as morning and evening stars and island reversals. Any signals generated by indicators will be generated by real data, by prices that actually traded, as opposed to inserted data, which, by definition, would generate a fals e signal, and potentially an erroneous one. This is especially important in back testing, because, while in a back test a false early entry might be triggered, or a false better stop price. In real life, since those prices did not trade, no action could ha ve been taken and the “signal” will always show up in the past tense. Because gaps are shown as they naturally occur and bars are not broken up with false data, the real risk in the market, which is proportional to the real range of what actually traded, will not be masked, potentially lulling the user into employing incorrect stops that trigger retroactively. The first chart below shows the perpetual natural gas contract plotted on a 60 - miunte time frame from March 17 to April 9. The average true range o ver the last 180 bars was approximately $0.035. However, when prices spiked on March 19 the range for one bar widened to $0.723, nearly 21 times the average true range. Later, during the decline, on March 27 one bar had a range of $0.297, nearly 8.5 times the average true range. NG Perpetual 60 - Minute Bars The next chart shows Kase Bars plotted over the same period of time with a $0.035 true range target. Here the chart shows the gap that took place and was a much smoother move up and down. The range of each bar consistently stayed near the target range of $0.035. This reduces risk because there are no “blow outs” in the range of the bars. NG Perpetual $0.035 Kase Bars Currently Kase Bars are only available on TradeStation and Bloomberg. For more inf ormation about Kase Bars, or to obtain information on how to trial KaseBars, please contact us at 505 - 237 - 1600 or email askkase@kaseco.com