
Introduction The present tectonics of Iran has resulted from the continental convergence of the Arabian and Eurasian plates Our study area Fig1 comprises a part of this collision zone and consists of an assemblage of distinct lithospheric ID: 1030606
Download Presentation The PPT/PDF document "Seismic anisotropy and mantle deformatio..." is the property of its rightful owner. Permission is granted to download and print the materials on this web site for personal, non-commercial use only, and to display it on your personal computer provided you do not modify the materials and that you retain all copyright notices contained in the materials. By downloading content from our website, you accept the terms of this agreement.

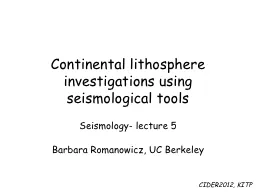
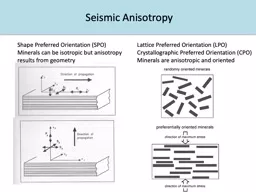


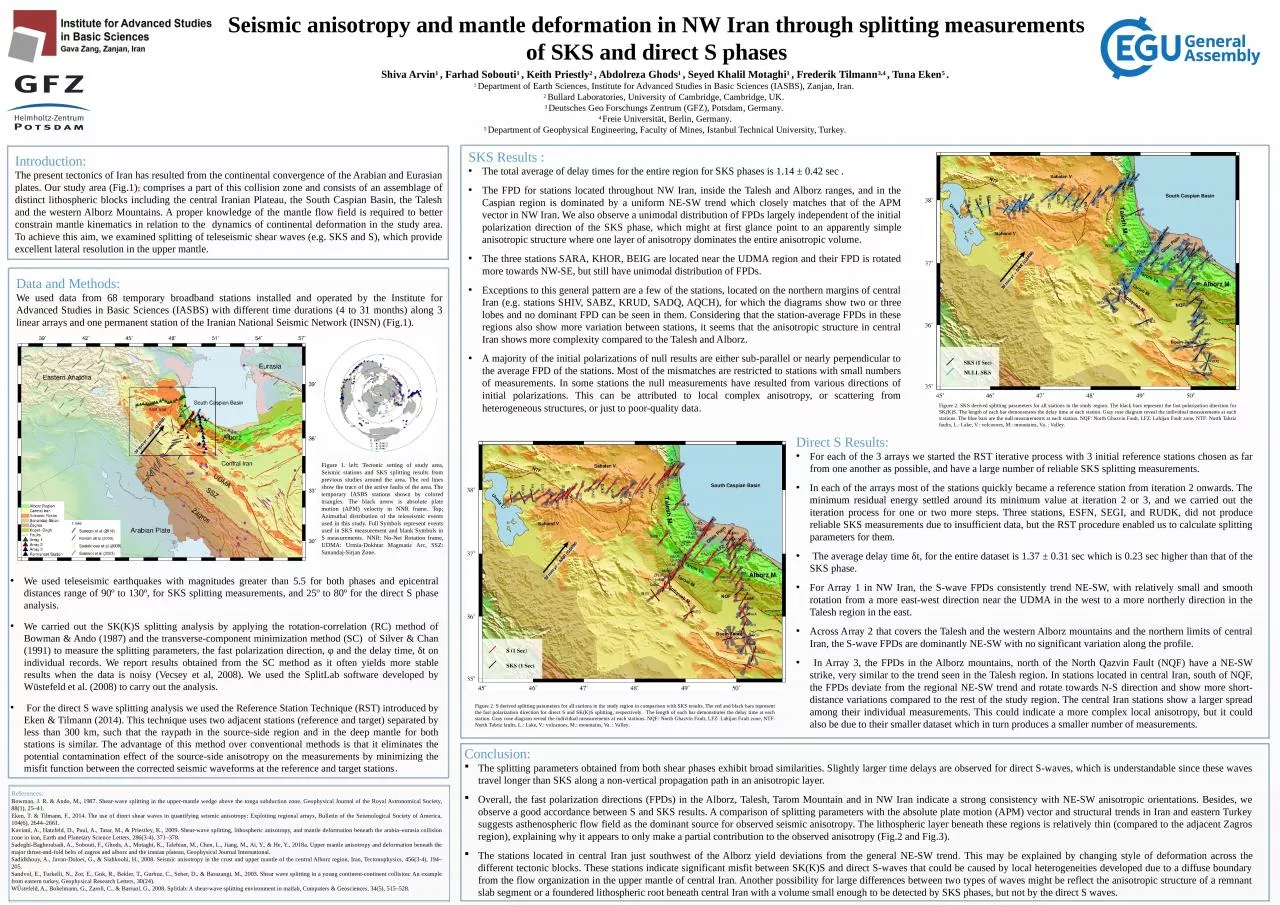
1. Seismic anisotropy and mantle deformation in NW Iran through splitting measurements of SKS and direct S phasesIntroduction:The present tectonics of Iran has resulted from the continental convergence of the Arabian and Eurasian plates. Our study area (Fig.1), comprises a part of this collision zone and consists of an assemblage of distinct lithospheric blocks including the central Iranian Plateau, the South Caspian Basin, the Talesh and the western Alborz Mountains. A proper knowledge of the mantle flow field is required to better constrain mantle kinematics in relation to the dynamics of continental deformation in the study area. To achieve this aim, we examined splitting of teleseismic shear waves (e.g. SKS and S), which provide excellent lateral resolution in the upper mantle. Data and Methods: We used data from 68 temporary broadband stations installed and operated by the Institute for Advanced Studies in Basic Sciences (IASBS) with different time durations (4 to 31 months) along 3 linear arrays and one permanent station of the Iranian National Seismic Network (INSN) (Fig.1). Shiva Arvin1 , Farhad Sobouti1 , Keith Priestly2 , Abdolreza Ghods1 , Seyed Khalil Motaghi1 , Frederik Tilmann3,4 , Tuna Eken5 .1 Department of Earth Sciences, Institute for Advanced Studies in Basic Sciences (IASBS), Zanjan, Iran. 2 Bullard Laboratories, University of Cambridge, Cambridge, UK. 3 Deutsches Geo Forschungs Zentrum (GFZ), Potsdam, Germany. 4 Freie Universität, Berlin, Germany.5 Department of Geophysical Engineering, Faculty of Mines, Istanbul Technical University, Turkey.We used teleseismic earthquakes with magnitudes greater than 5.5 for both phases and epicentral distances range of 90º to 130º, for SKS splitting measurements, and 25º to 80º for the direct S phase analysis.We carried out the SK(K)S splitting analysis by applying the rotation-correlation (RC) method of Bowman & Ando (1987) and the transverse-component minimization method (SC) of Silver & Chan (1991) to measure the splitting parameters, the fast polarization direction, φ and the delay time, δt on individual records. We report results obtained from the SC method as it often yields more stable results when the data is noisy (Vecsey et al, 2008). We used the SplitLab software developed by Wüstefeld et al. (2008) to carry out the analysis. For the direct S wave splitting analysis we used the Reference Station Technique (RST) introduced by Eken & Tilmann (2014). This technique uses two adjacent stations (reference and target) separated by less than 300 km, such that the raypath in the source-side region and in the deep mantle for both stations is similar. The advantage of this method over conventional methods is that it eliminates the potential contamination effect of the source-side anisotropy on the measurements by minimizing the misfit function between the corrected seismic waveforms at the reference and target stations.References:Bowman, J. R. & Ando, M., 1987. Shear-wave splitting in the upper-mantle wedge above the tonga subduction zone, Geophysical Journal of the Royal Astronomical Society, 88(1), 25–41.Eken, T. & Tilmann, F., 2014. The use of direct shear waves in quantifying seismic anisotropy: Exploiting regional arrays, Bulletin of the Seismological Society of America, 104(6), 2644–2661.Kaviani, A., Hatzfeld, D., Paul, A., Tatar, M., & Priestley, K., 2009. Shear-wave splitting, lithospheric anisotropy, and mantle deformation beneath the arabia–eurasia collision zone in iran, Earth and Planetary Science Letters, 286(3-4), 371–378.Sadeghi-Bagherabadi, A., Sobouti, F., Ghods, A., Motaghi, K., Talebian, M., Chen, L., Jiang, M., Ai, Y., & He, Y., 2018a. Upper mantle anisotropy and deformation beneath the major thrust-and-fold belts of zagros and alborz and the iranian plateau, Geophysical Journal International.Sadidkhouy, A., Javan-Doloei, G., & Siahkoohi, H., 2008. Seismic anisotropy in the crust and upper mantle of the central Alborz region, Iran, Tectonophysics, 456(3-4), 194–205.Sandvol, E., Turkelli, N., Zor, E., Gok, R., Bekler, T., Gurbuz, C., Seber, D., & Barazangi, M., 2003. Shear wave splitting in a young continent-continent collision: An example from eastern turkey, Geophysical Research Letters, 30(24).WÜstefeld, A., Bokelmann, G., Zaroli, C., & Barruol, G., 2008. Splitlab: A shear-wave splitting environment in matlab, Computers & Geosciences, 34(5), 515–528.SKS Results :The total average of delay times for the entire region for SKS phases is 1.14 ± 0.42 sec .The FPD for stations located throughout NW Iran, inside the Talesh and Alborz ranges, and in the Caspian region is dominated by a uniform NE-SW trend which closely matches that of the APM vector in NW Iran. We also observe a unimodal distribution of FPDs largely independent of the initial polarization direction of the SKS phase, which might at first glance point to an apparently simple anisotropic structure where one layer of anisotropy dominates the entire anisotropic volume. The three stations SARA, KHOR, BEIG are located near the UDMA region and their FPD is rotated more towards NW-SE, but still have unimodal distribution of FPDs. Exceptions to this general pattern are a few of the stations, located on the northern margins of central Iran (e.g. stations SHIV, SABZ, KRUD, SADQ, AQCH), for which the diagrams show two or three lobes and no dominant FPD can be seen in them. Considering that the station-average FPDs in these regions also show more variation between stations, it seems that the anisotropic structure in central Iran shows more complexity compared to the Talesh and Alborz. A majority of the initial polarizations of null results are either sub-parallel or nearly perpendicular to the average FPD of the stations. Most of the mismatches are restricted to stations with small numbers of measurements. In some stations the null measurements have resulted from various directions of initial polarizations. This can be attributed to local complex anisotropy, or scattering from heterogeneous structures, or just to poor-quality data. Direct S Results:For each of the 3 arrays we started the RST iterative process with 3 initial reference stations chosen as far from one another as possible, and have a large number of reliable SKS splitting measurements. In each of the arrays most of the stations quickly became a reference station from iteration 2 onwards. The minimum residual energy settled around its minimum value at iteration 2 or 3, and we carried out the iteration process for one or two more steps. Three stations, ESFN, SEGI, and RUDK, did not produce reliable SKS measurements due to insufficient data, but the RST procedure enabled us to calculate splitting parameters for them. The average delay time δt, for the entire dataset is 1.37 ± 0.31 sec which is 0.23 sec higher than that of the SKS phase. For Array 1 in NW Iran, the S-wave FPDs consistently trend NE-SW, with relatively small and smooth rotation from a more east-west direction near the UDMA in the west to a more northerly direction in the Talesh region in the east. Across Array 2 that covers the Talesh and the western Alborz mountains and the northern limits of central Iran, the S-wave FPDs are dominantly NE-SW with no significant variation along the profile. In Array 3, the FPDs in the Alborz mountains, north of the North Qazvin Fault (NQF) have a NE-SW strike, very similar to the trend seen in the Talesh region. In stations located in central Iran, south of NQF, the FPDs deviate from the regional NE-SW trend and rotate towards N-S direction and show more short-distance variations compared to the rest of the study region. The central Iran stations show a larger spread among their individual measurements. This could indicate a more complex local anisotropy, but it could also be due to their smaller dataset which in turn produces a smaller number of measurements. Conclusion:The splitting parameters obtained from both shear phases exhibit broad similarities. Slightly larger time delays are observed for direct S-waves, which is understandable since these waves travel longer than SKS along a non-vertical propagation path in an anisotropic layer. Overall, the fast polarization directions (FPDs) in the Alborz, Talesh, Tarom Mountain and in NW Iran indicate a strong consistency with NE-SW anisotropic orientations. Besides, we observe a good accordance between S and SKS results. A comparison of splitting parameters with the absolute plate motion (APM) vector and structural trends in Iran and eastern Turkey suggests asthenospheric flow field as the dominant source for observed seismic anisotropy. The lithospheric layer beneath these regions is relatively thin (compared to the adjacent Zagros region), explaining why it appears to only make a partial contribution to the observed anisotropy (Fig.2 and Fig.3). The stations located in central Iran just southwest of the Alborz yield deviations from the general NE-SW trend. This may be explained by changing style of deformation across the different tectonic blocks. These stations indicate significant misfit between SK(K)S and direct S-waves that could be caused by local heterogeneities developed due to a diffuse boundary from the flow organization in the upper mantle of central Iran. Another possibility for large differences between two types of waves might be reflect the anisotropic structure of a remnant slab segment or a foundered lithospheric root beneath central Iran with a volume small enough to be detected by SKS phases, but not by the direct S waves.Figure 1. left; Tectonic setting of study area, Seismic stations and SKS splitting results from previous studies around the area. The red lines show the trace of the active faults of the area. The temporary IASBS stations shown by colored triangles. The black arrow is absolute plate motion (APM) velocity in NNR frame. Top; Azimuthal distribution of the teleseismic events used in this study. Full Symbols represent events used in SKS measurement and blank Symbols in S measurements. NNR: No-Net Rotation frame, UDMA: Urmia-Dokhtar Magmatic Arc, SSZ: Sanandaj-Sirjan Zone.Figure 2. SKS derived splitting parameters for all stations in the study region. The black bars represent the fast polarization direction for SK(K)S. The length of each bar demonstrates the delay time at each station. Gray rose diagram reveal the individual measurements at each stations. The blue bars are the null measurements at each station. NQF: North Ghazvin Fault, LFZ: Lahijan Fault zone, NTF: North Tabriz faults, L.: Lake, V.: volcanoes, M.: mountains, Va. : Valley.Figure 2. S derived splitting parameters for all stations in the study region in comparison with SKS results. The red and black bars represent the fast polarization direction for direct S and SK(K)S splitting, respectively . The length of each bar demonstrates the delay time at each station. Gray rose diagram reveal the individual measurements at each stations. NQF: North Ghazvin Fault, LFZ: Lahijan Fault zone, NTF: North Tabriz faults, L.: Lake, V.: volcanoes, M.: mountains, Va. : Valley.