
In this experiment we will continue to study acid phosphatase kinetics Objective To establish the relationship between enzyme concentration and the rate of an enzyme catalyzed reaction The reaction rate will increase as the concentration of enzymes is increased but there must be a ID: 907995
Download Presentation The PPT/PDF document "The Effect of Enzyme Concentration on th..." is the property of its rightful owner. Permission is granted to download and print the materials on this web site for personal, non-commercial use only, and to display it on your personal computer provided you do not modify the materials and that you retain all copyright notices contained in the materials. By downloading content from our website, you accept the terms of this agreement.


Slide1
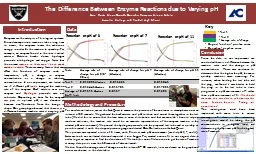
The Effect of Enzyme Concentration on the Rate of an Enzyme Catalyzed Reaction.
Slide2In this experiment, we will continue to study acid phosphatase kinetics.
Slide3Objective:
To establish the relationship between enzyme concentration and the rate of an enzyme catalyzed reaction.
Slide4The reaction rate will increase as the concentration of enzymes is increased but there must be a
large excess of substrate
This is a
linear relationship.
The initial rate of reaction
is directly proportional to the enzyme concentration
V α [E]
More Enzyme molecule can react with more substrate molecules, so the
initial rate will increase.
The effect of enzyme concentration on velocity
Slide5Principal of the enzyme assay in vitro
Under acid conditions, the enzyme catalyzes the hydrolysis of p-
nitrophenyl
phosphate (
pNPP
) to inorganic phosphate and p-
nitrophenol
.Both p-nitrophenyl phosphate and p-
nitrophenol are colorless at acidic pH values.Under
alkaline conditions
, p-
nitrophenol is converted to a p-nitrophenolate (yellow color) and concentration can be measured at 405 nm.
1
2
Slide6Blank
A
C
B
E
D
F
G
All the factors that affect enzyme kinetics are constant
except
enzyme concentration
where it varies in each tube
Time = 5 min pH= 5.7 Temp= 37
o
C
[S] = 0.05M
Add to each tube:
0.5 ml of buffer
0.5 ml of
pNPP
0.5 ml MgCl
2
Water
Method:
PS:
Water volume will differ in each tube since each tube
have different
[E]
.
5.5 ml of dis. H
2
O
5.3 ml of dis. H
2
O
5.2 ml of dis. H
2
O
5.1 ml of dis. H
2O
5 ml of dis. H2O
4.9 ml of dis. H2O
4.7 ml of dis. H2O
4.5 ml of dis. H2O
Place in a water bath maintained at 37 ºC for 5 minutes.
Place in a water bath maintained at 37 ºC for 5 minutes.
Place in a water bath maintained at 37 ºC for 5 minutes.
Place in a water bath maintained at 37 ºC for 5 minutes.
We want to see the effect of enzyme concentration on the velocity, so every tube will have different enzyme concentration (dilution)
Place in a water bath maintained at 37 ºC for 5 minutes.
Slide7Blank
B
A
C
E
D
G
F
0
ml of Enzyme
0.4
ml of Enzyme
0.5
ml of Enzyme
0.6
ml of Enzyme
0.8
ml of Enzyme
1
ml of Enzyme
0.2
ml of Enzyme
0.3
ml of Enzyme
To start the reaction
add the corresponding enzyme volume to each tube
To stop the reaction
add
0.5ml of KOH
All additions f
E
and
KOH
must be in 37
0C water bath Note that the blank do not contain any enzyme
Start at
0
0
2
46810
12Stop at0
579
111315
17
After all the reactions have been terminated, determine the absorbance at 405 nm
for each sample against blank.
Slide8To convert the time table to an easier way try the following
Tube
A
B
C
D
E
F
G
Start at
0
2
4
6
8
10
12
Stop at
5
7
9
11
13
15
17
Slide9Velocity (µmole of PNP/min)
Absorbance 405 nm
Enzyme concentration (ml)
Tube
0
Blank
0.2
A
0.3
B
0.4
C
0.5
D
0.6
E
0.8
F
1
G
Results :
Slide10Calculations:
Velocity (V)
= (A x 10
6
) /(E x time)=
µmole of PNP/min
A= absorbance
E= extension coefficient=18.8 x 10
3Time = 5 min
Slide11[E] (ml)
Velocity
(µmole of PNP/min)
The Effect of Enzyme Concentration on the Rate of an Enzyme Catalyzed Reaction.
“Linear curve”
Slide12Discussion:
An introductory statement (In this experiment, we studied the effect of different enzyme concentrations on the rate of acid phosphatase catalyzed reaction.)
Principle
Describe the shape of curve you get.
Comment on the relationship between [E] and the rate of the reaction.
Slide13Question:
Assuming that there is a large excess of substrate. The rate of reaction will increase with increasing enzyme concentration.
WHY?